Confluent Platform 7.9 · Apache Kafka · Kafka Connect · Schema Registry · ksqlDB · Control Center
Confluent Platform, screen by screen: a streaming pipeline you can open in a browser
Kafka is easy to describe and hard to picture: topics, partitions, offsets and consumer groups are mostly invisible. This post runs the whole Confluent Platform on one machine, with live sample data flowing through it, and walks through Control Center one screen at a time: where the data comes from, where it lands, how its shape is governed, and how a SQL statement turns a stream of events into a continuously updated table.
The environment is live at confluent.maximo.me.uk. It is a sandbox: one broker, generated data, no sign-in.
- The six components of Confluent Platform and what each one is for.
- How sample data enters Kafka through a Connect source connector, with no code.
- What a topic looks like from the inside: partitions, offsets, messages and the Avro schema.
- How ksqlDB builds a live table from a stream with one SQL statement, and how to query it.
- How to read consumer lag, and one deployment trap with ksqlDB queries behind a proxy.
Reading time: about 12 minutes.
1 · The ideaThe pipeline in one picture
Two Datagen source connectors generate fake website traffic: page views and user profiles. Kafka Connect writes them to two topics, Schema Registry stores the Avro schema of each record, and ksqlDB reads the page views and keeps a running count per page in a new topic. Control Center watches all of it.
Every arrow is a Kafka topic. Connect, ksqlDB and Control Center do not call each
other directly; they read and write topics. Even Connect's own configuration, offsets and status are stored in topics
(_connect-configs, _connect-offsets, _connect-status).
2 · ArchitectureThe six containers
The platform runs as one Podman pod, so the six containers share localhost and find each other without
service discovery. All images are the public confluentinc/*:7.9.10 images.
| Container | Image | Port | What it does |
|---|---|---|---|
| Broker | cp-server | 9092 | Kafka itself, in KRaft mode: the same process is broker and controller, so there is no ZooKeeper. |
| Schema Registry | cp-schema-registry | 8081 | Stores Avro, JSON Schema and Protobuf schemas per subject and checks compatibility when a schema changes. |
| Kafka Connect | cp-server-connect | 8083 | Runs connectors that copy data in (sources) or out (sinks). The Datagen plugin is installed from Confluent Hub at start. |
| ksqlDB | cp-ksqldb-server | 8088 | Stream processing in SQL: streams, tables, joins and aggregations that run continuously. |
| REST Proxy | cp-kafka-rest | 8082 | Produce, consume and administer Kafka over HTTP, for clients that cannot speak the Kafka protocol. |
| Control Center | cp-enterprise-control-center | 9021 | The web console in this post. |
Kafka, Schema Registry, Connect, ksqlDB and REST Proxy are free to run. Control Center and cp-server are
enterprise components; on a single broker they run under the developer licence without a key.
3 · Control CenterThe cluster: home, overview, brokers
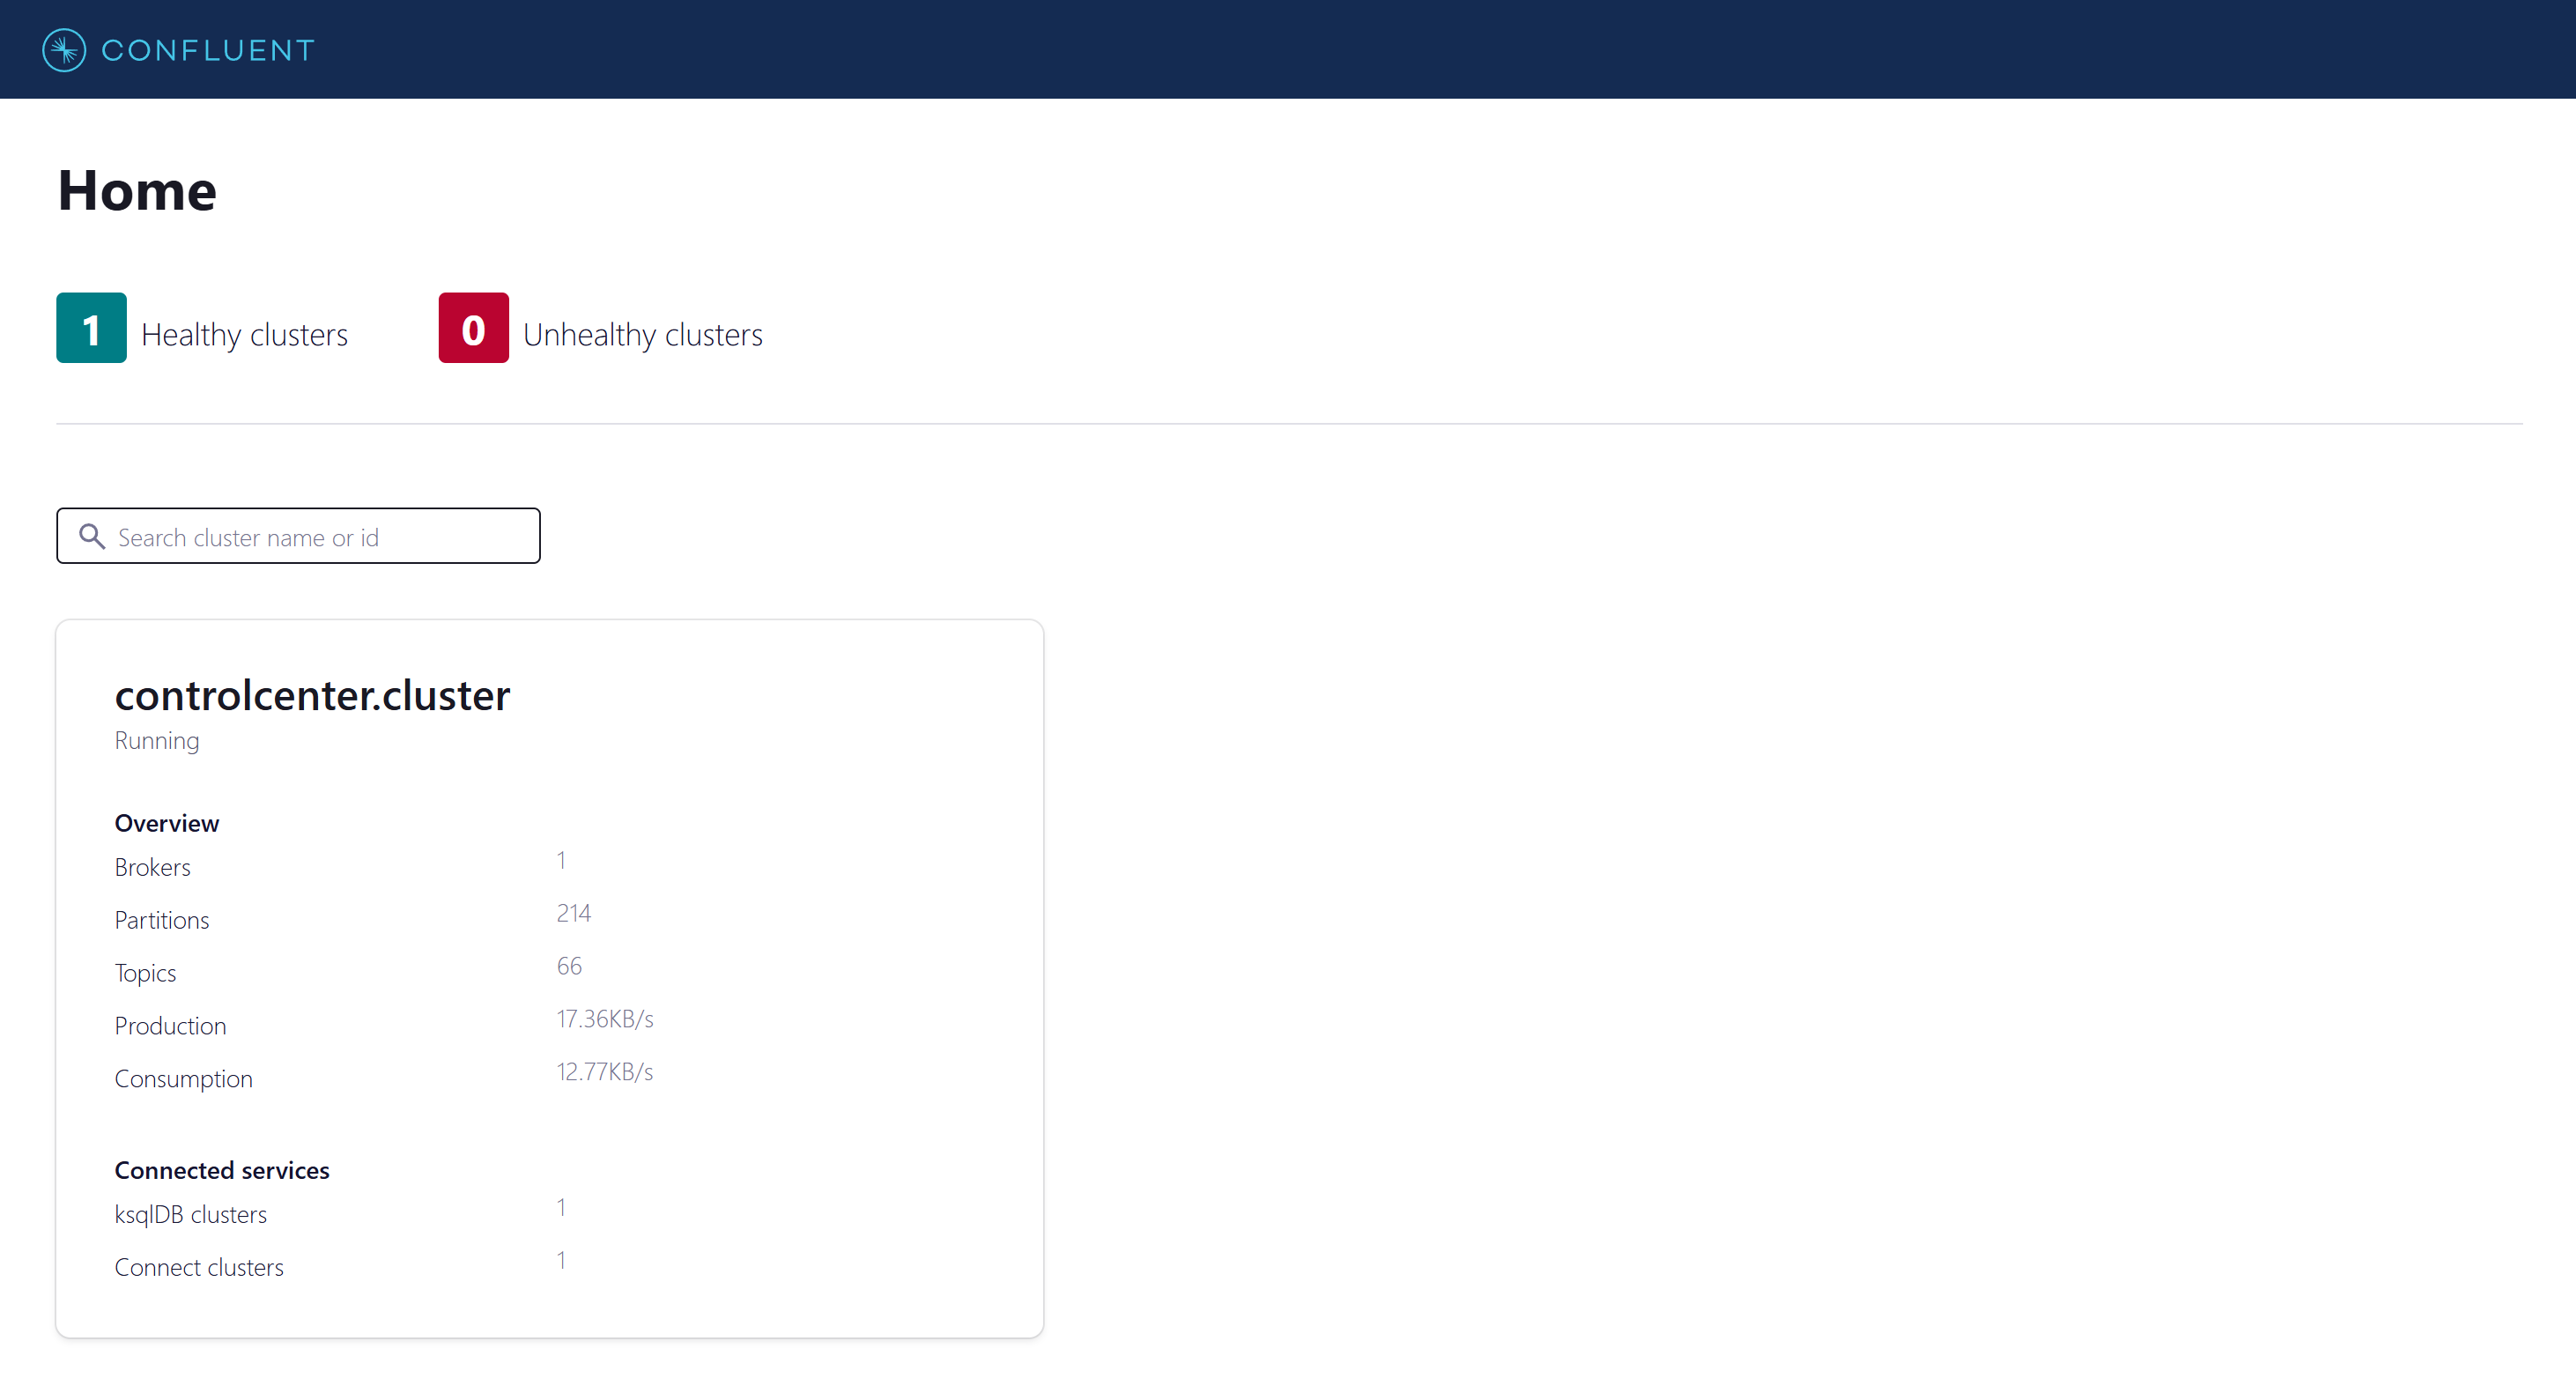
The home page lists the Kafka clusters Control Center manages. Here there is one, controlcenter.cluster,
with one ksqlDB cluster and one Connect cluster attached.
The cluster overview puts the counts in one place: brokers, topics, partitions, connectors, ksqlDB queries. The two numbers to watch on a real cluster are under-replicated partitions and out-of-sync replicas. Both should be zero; anything else means a broker is falling behind or is down.
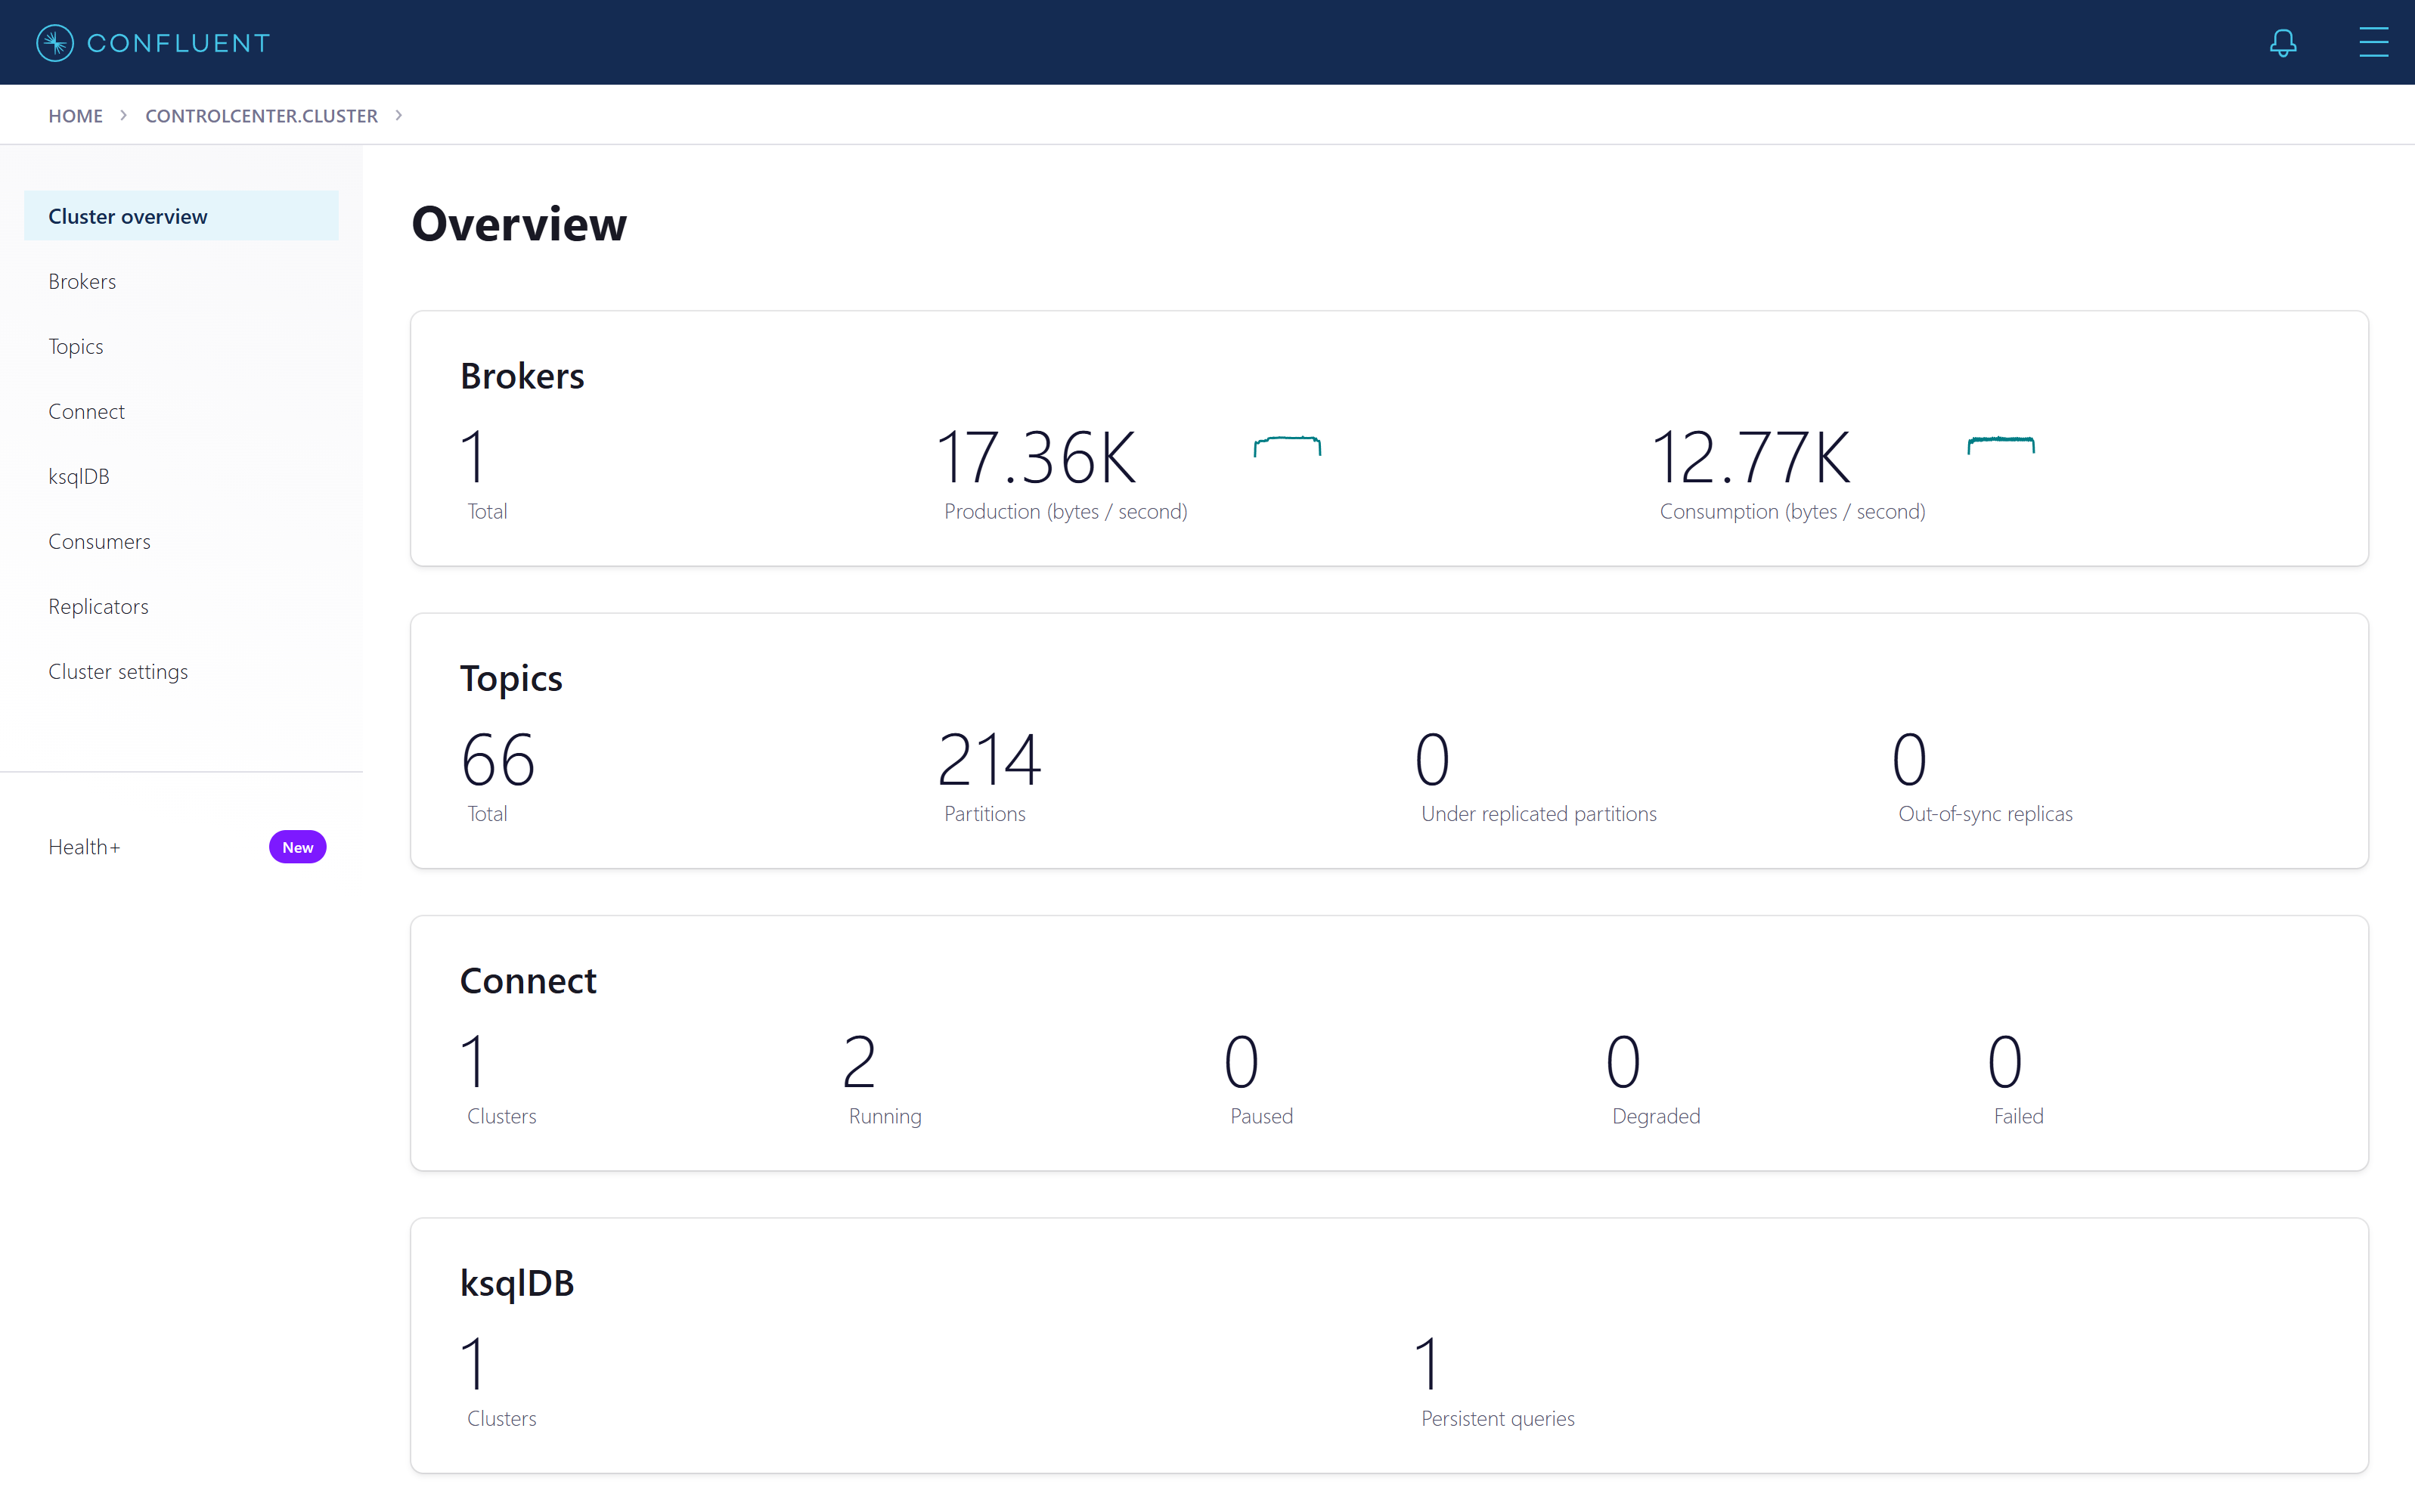
66 topics may look like a lot for two data sources. Most are internal: Control Center keeps its own aggregates in
Kafka Streams state topics, Connect stores its state in topics, and ksqlDB writes a command topic and a changelog for each
query. Only pageviews, users and PAGEVIEWS_PER_PAGE hold business data.
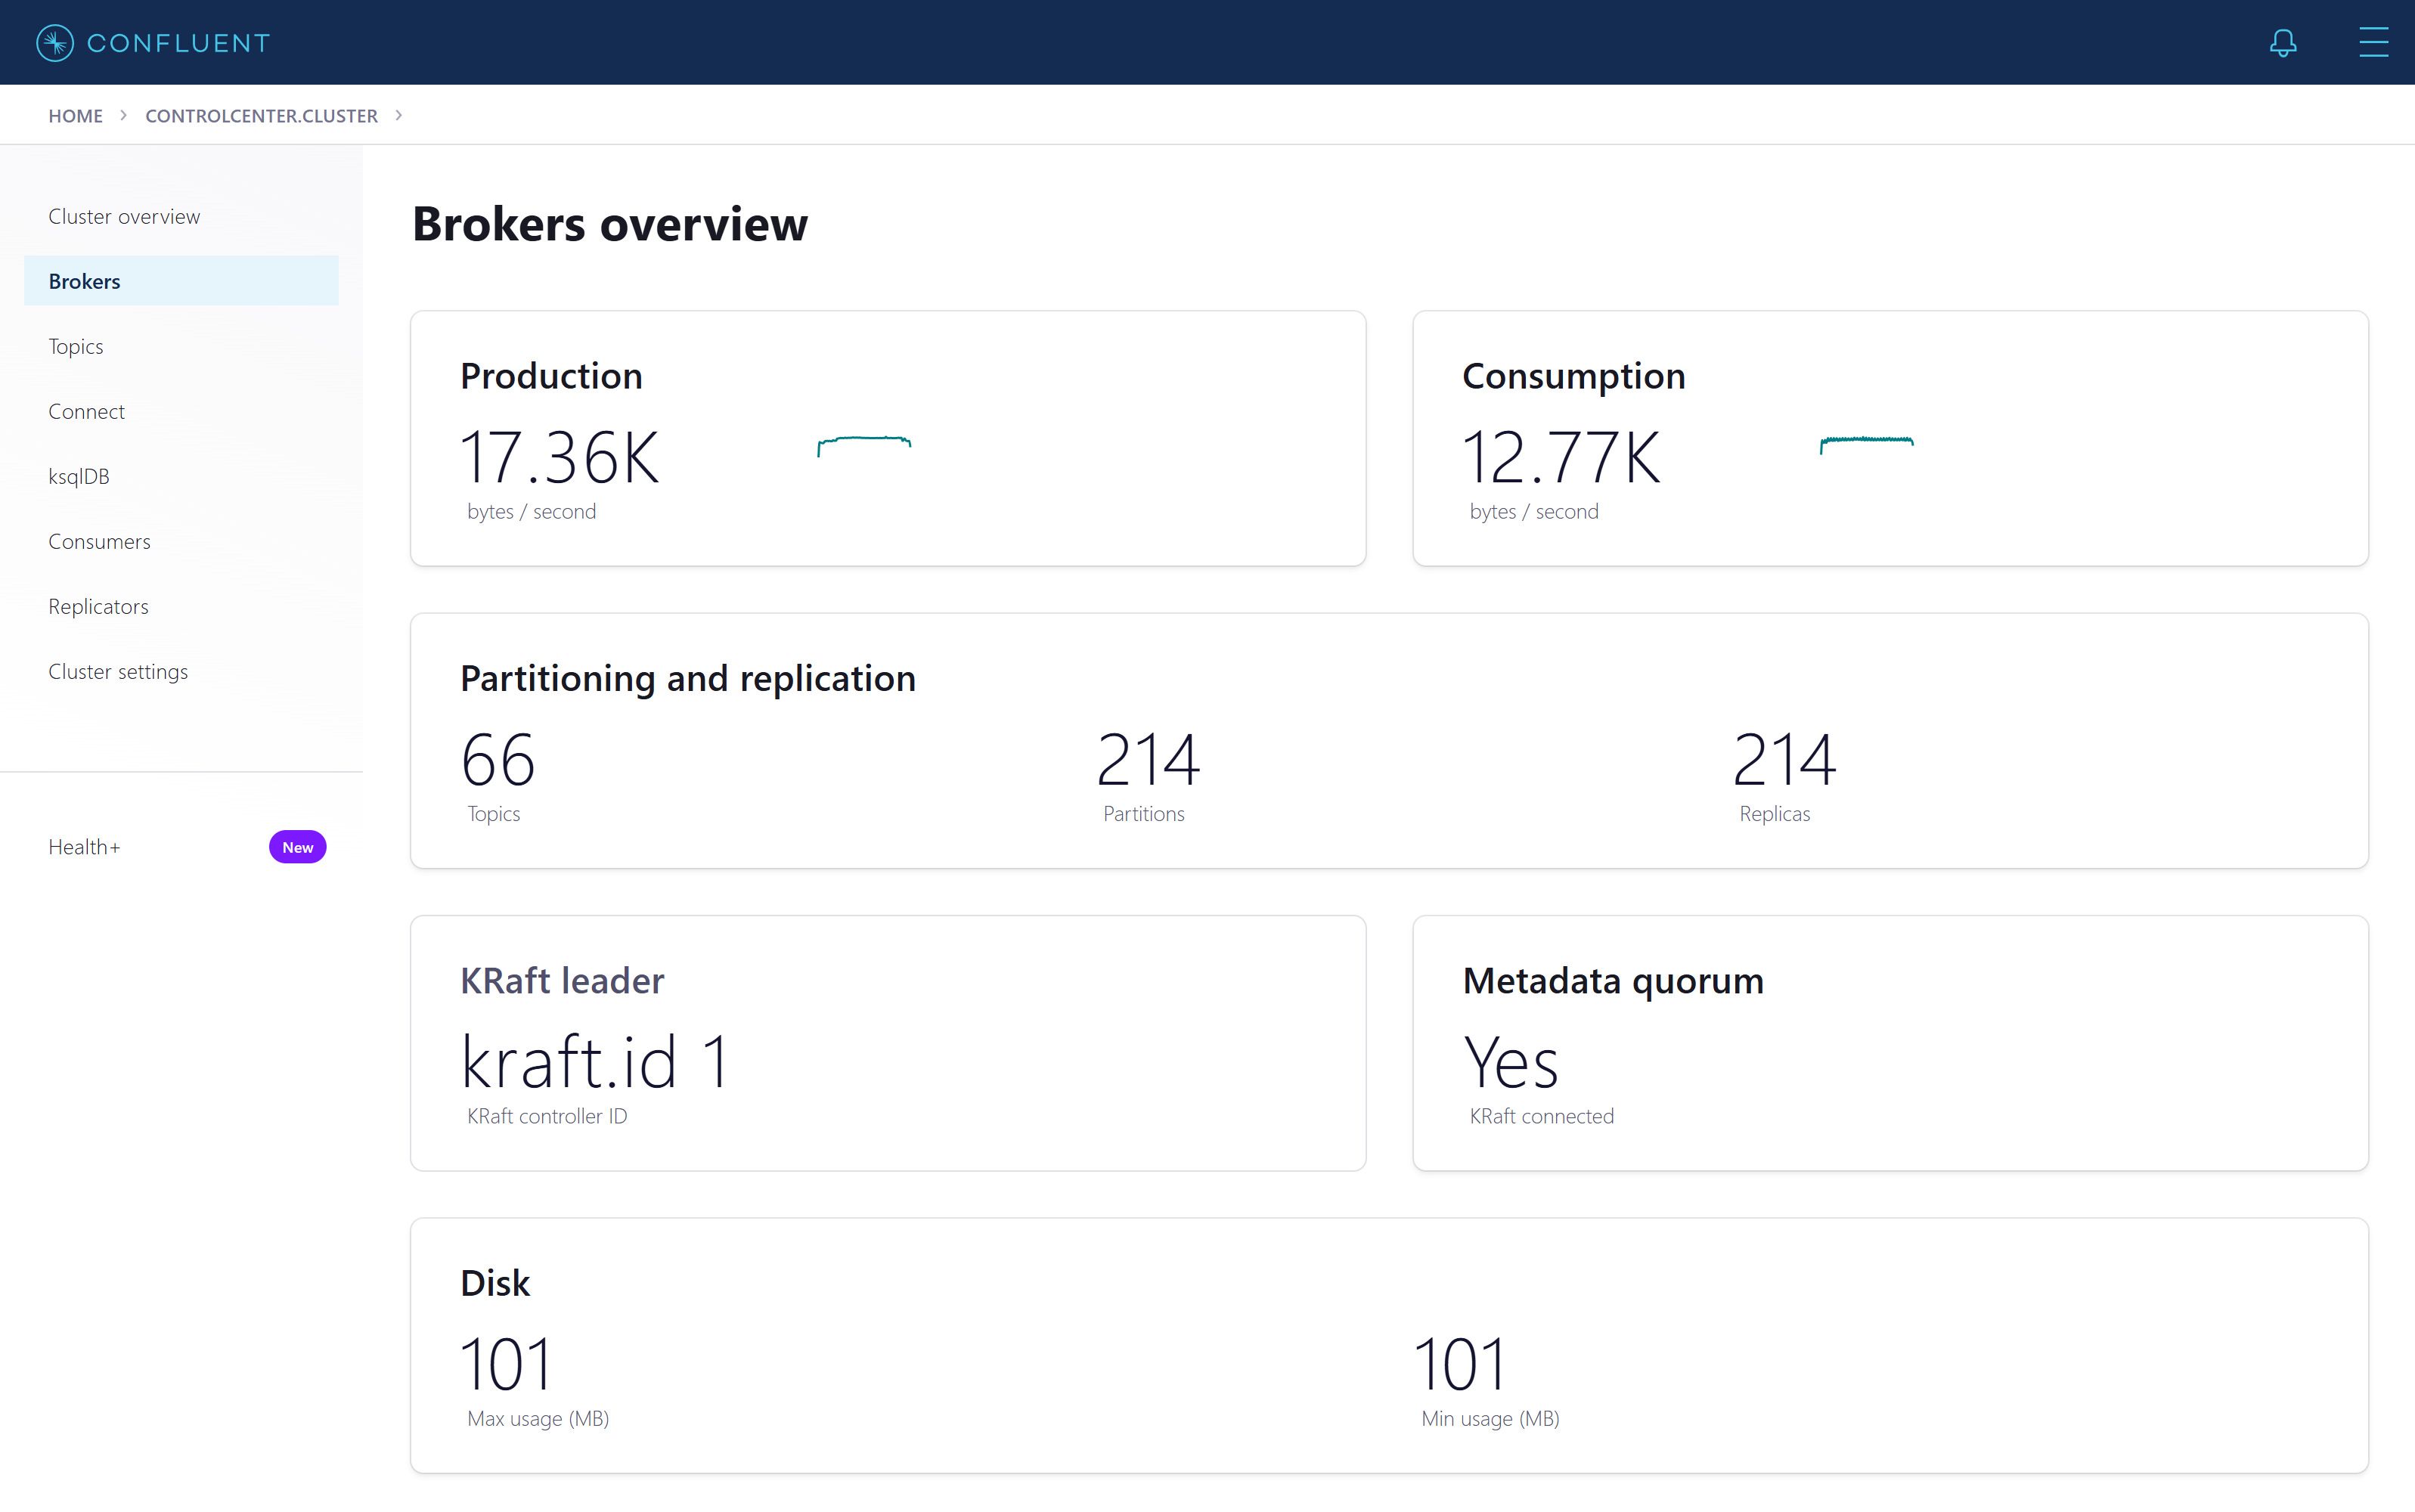
“KRaft leader kraft.id 1” and “Metadata quorum Yes” mean the cluster keeps its metadata in Kafka's own Raft log. Kafka 4.0 removed ZooKeeper entirely; Confluent Platform 7.9 still supports both, and this environment uses KRaft only.
4 · DataTopics, messages and schemas
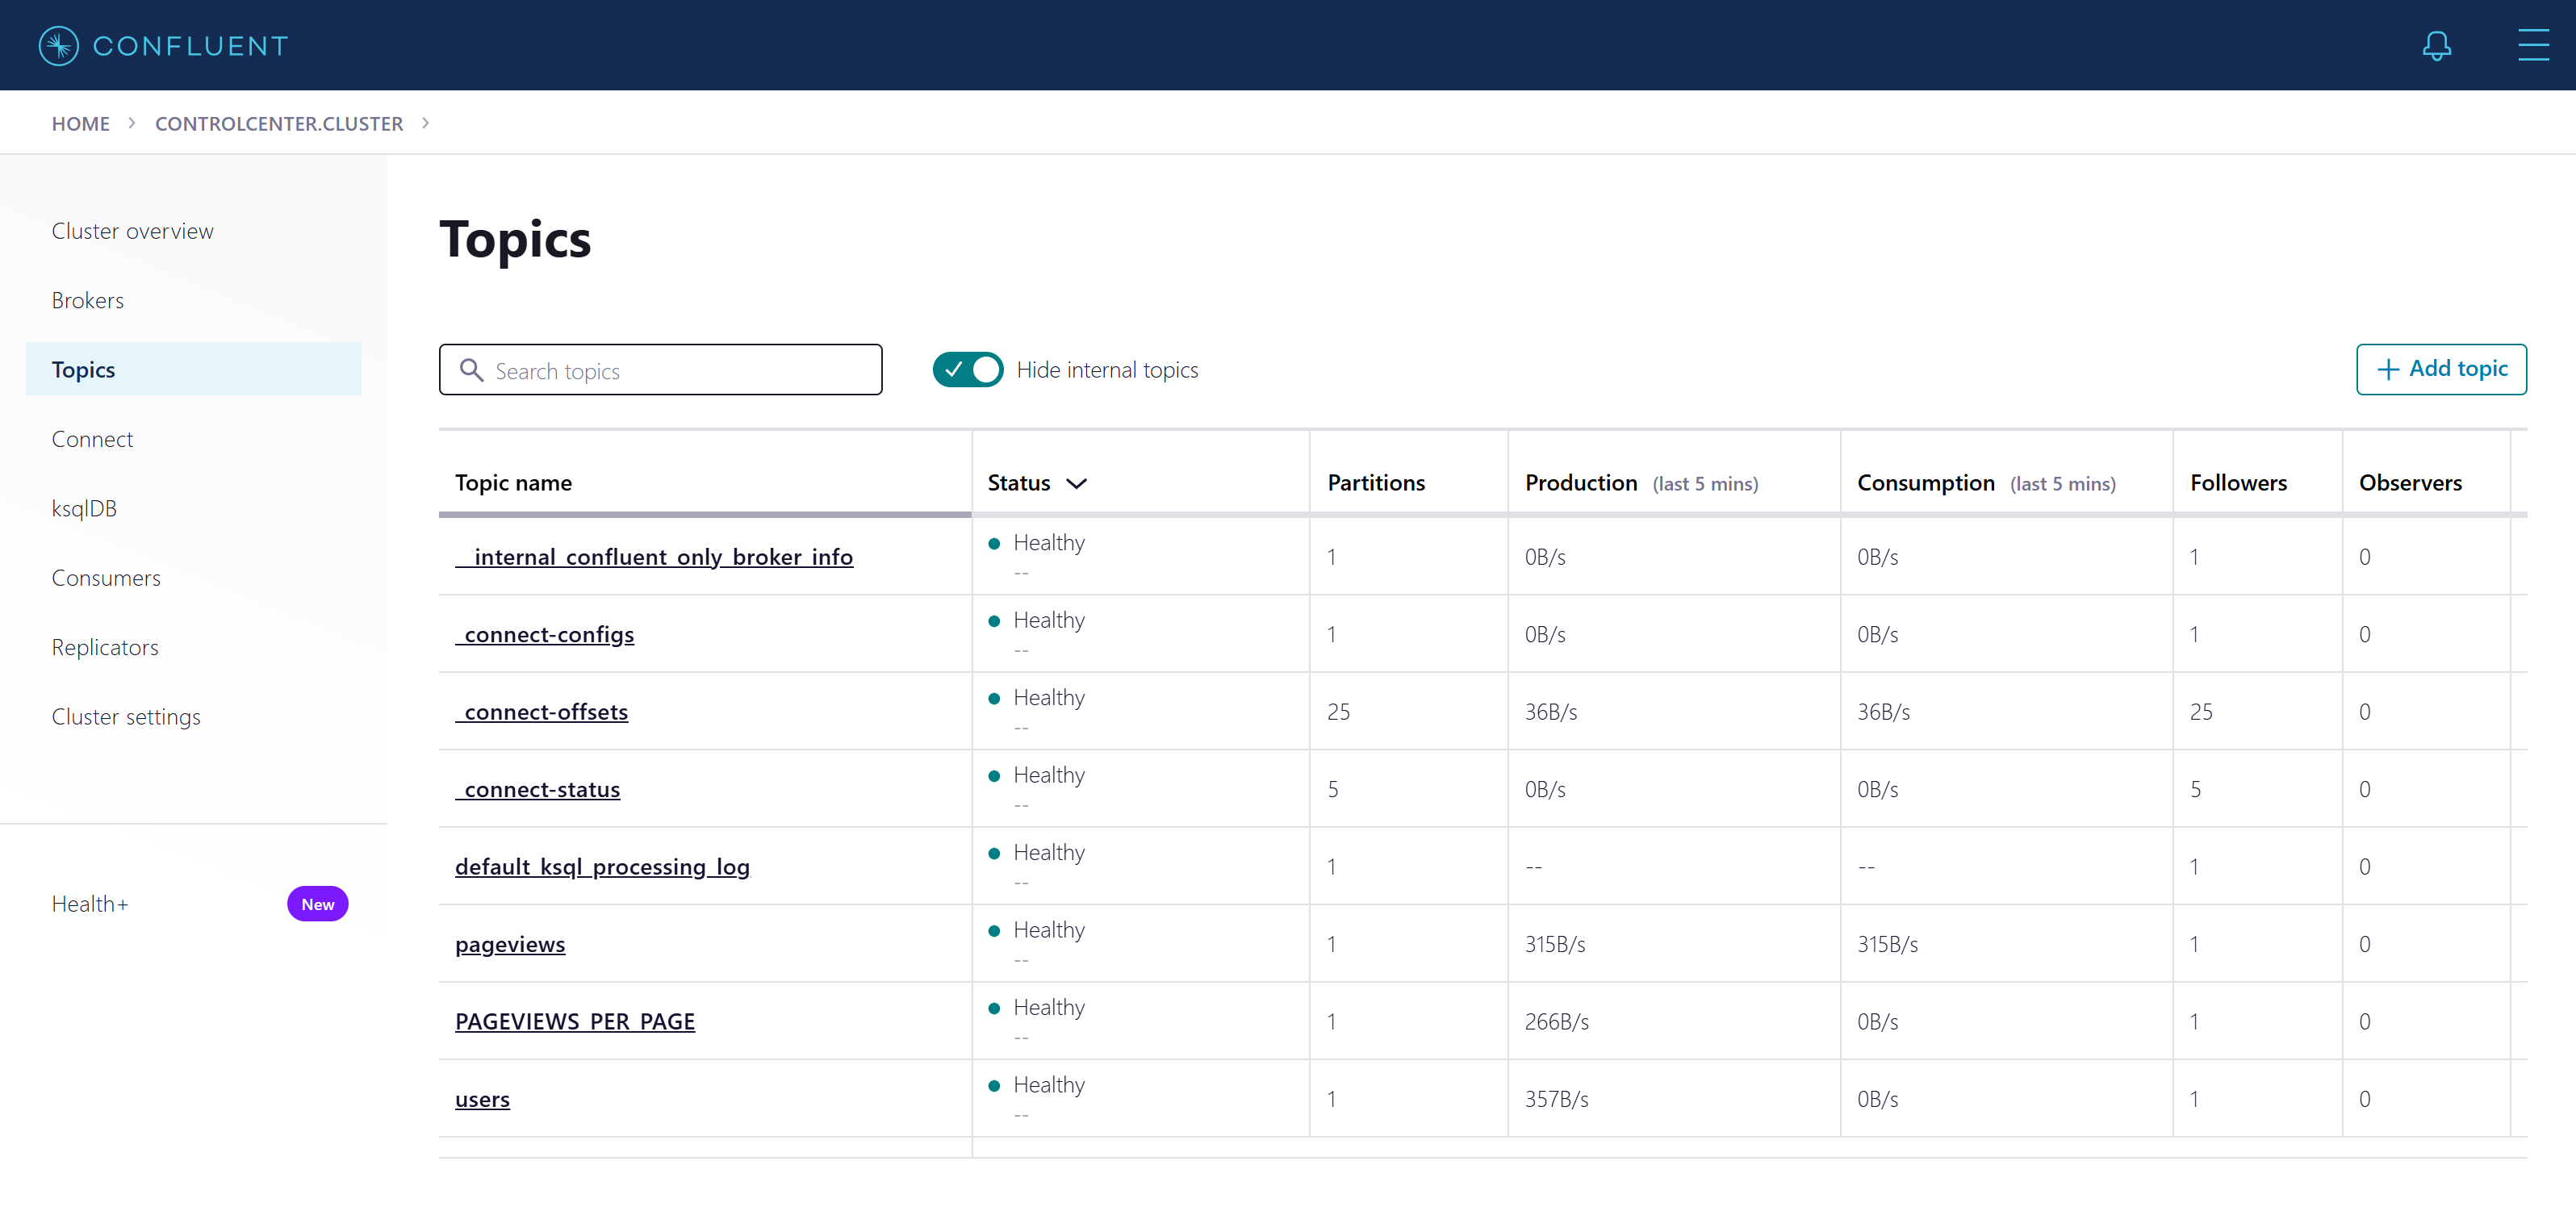
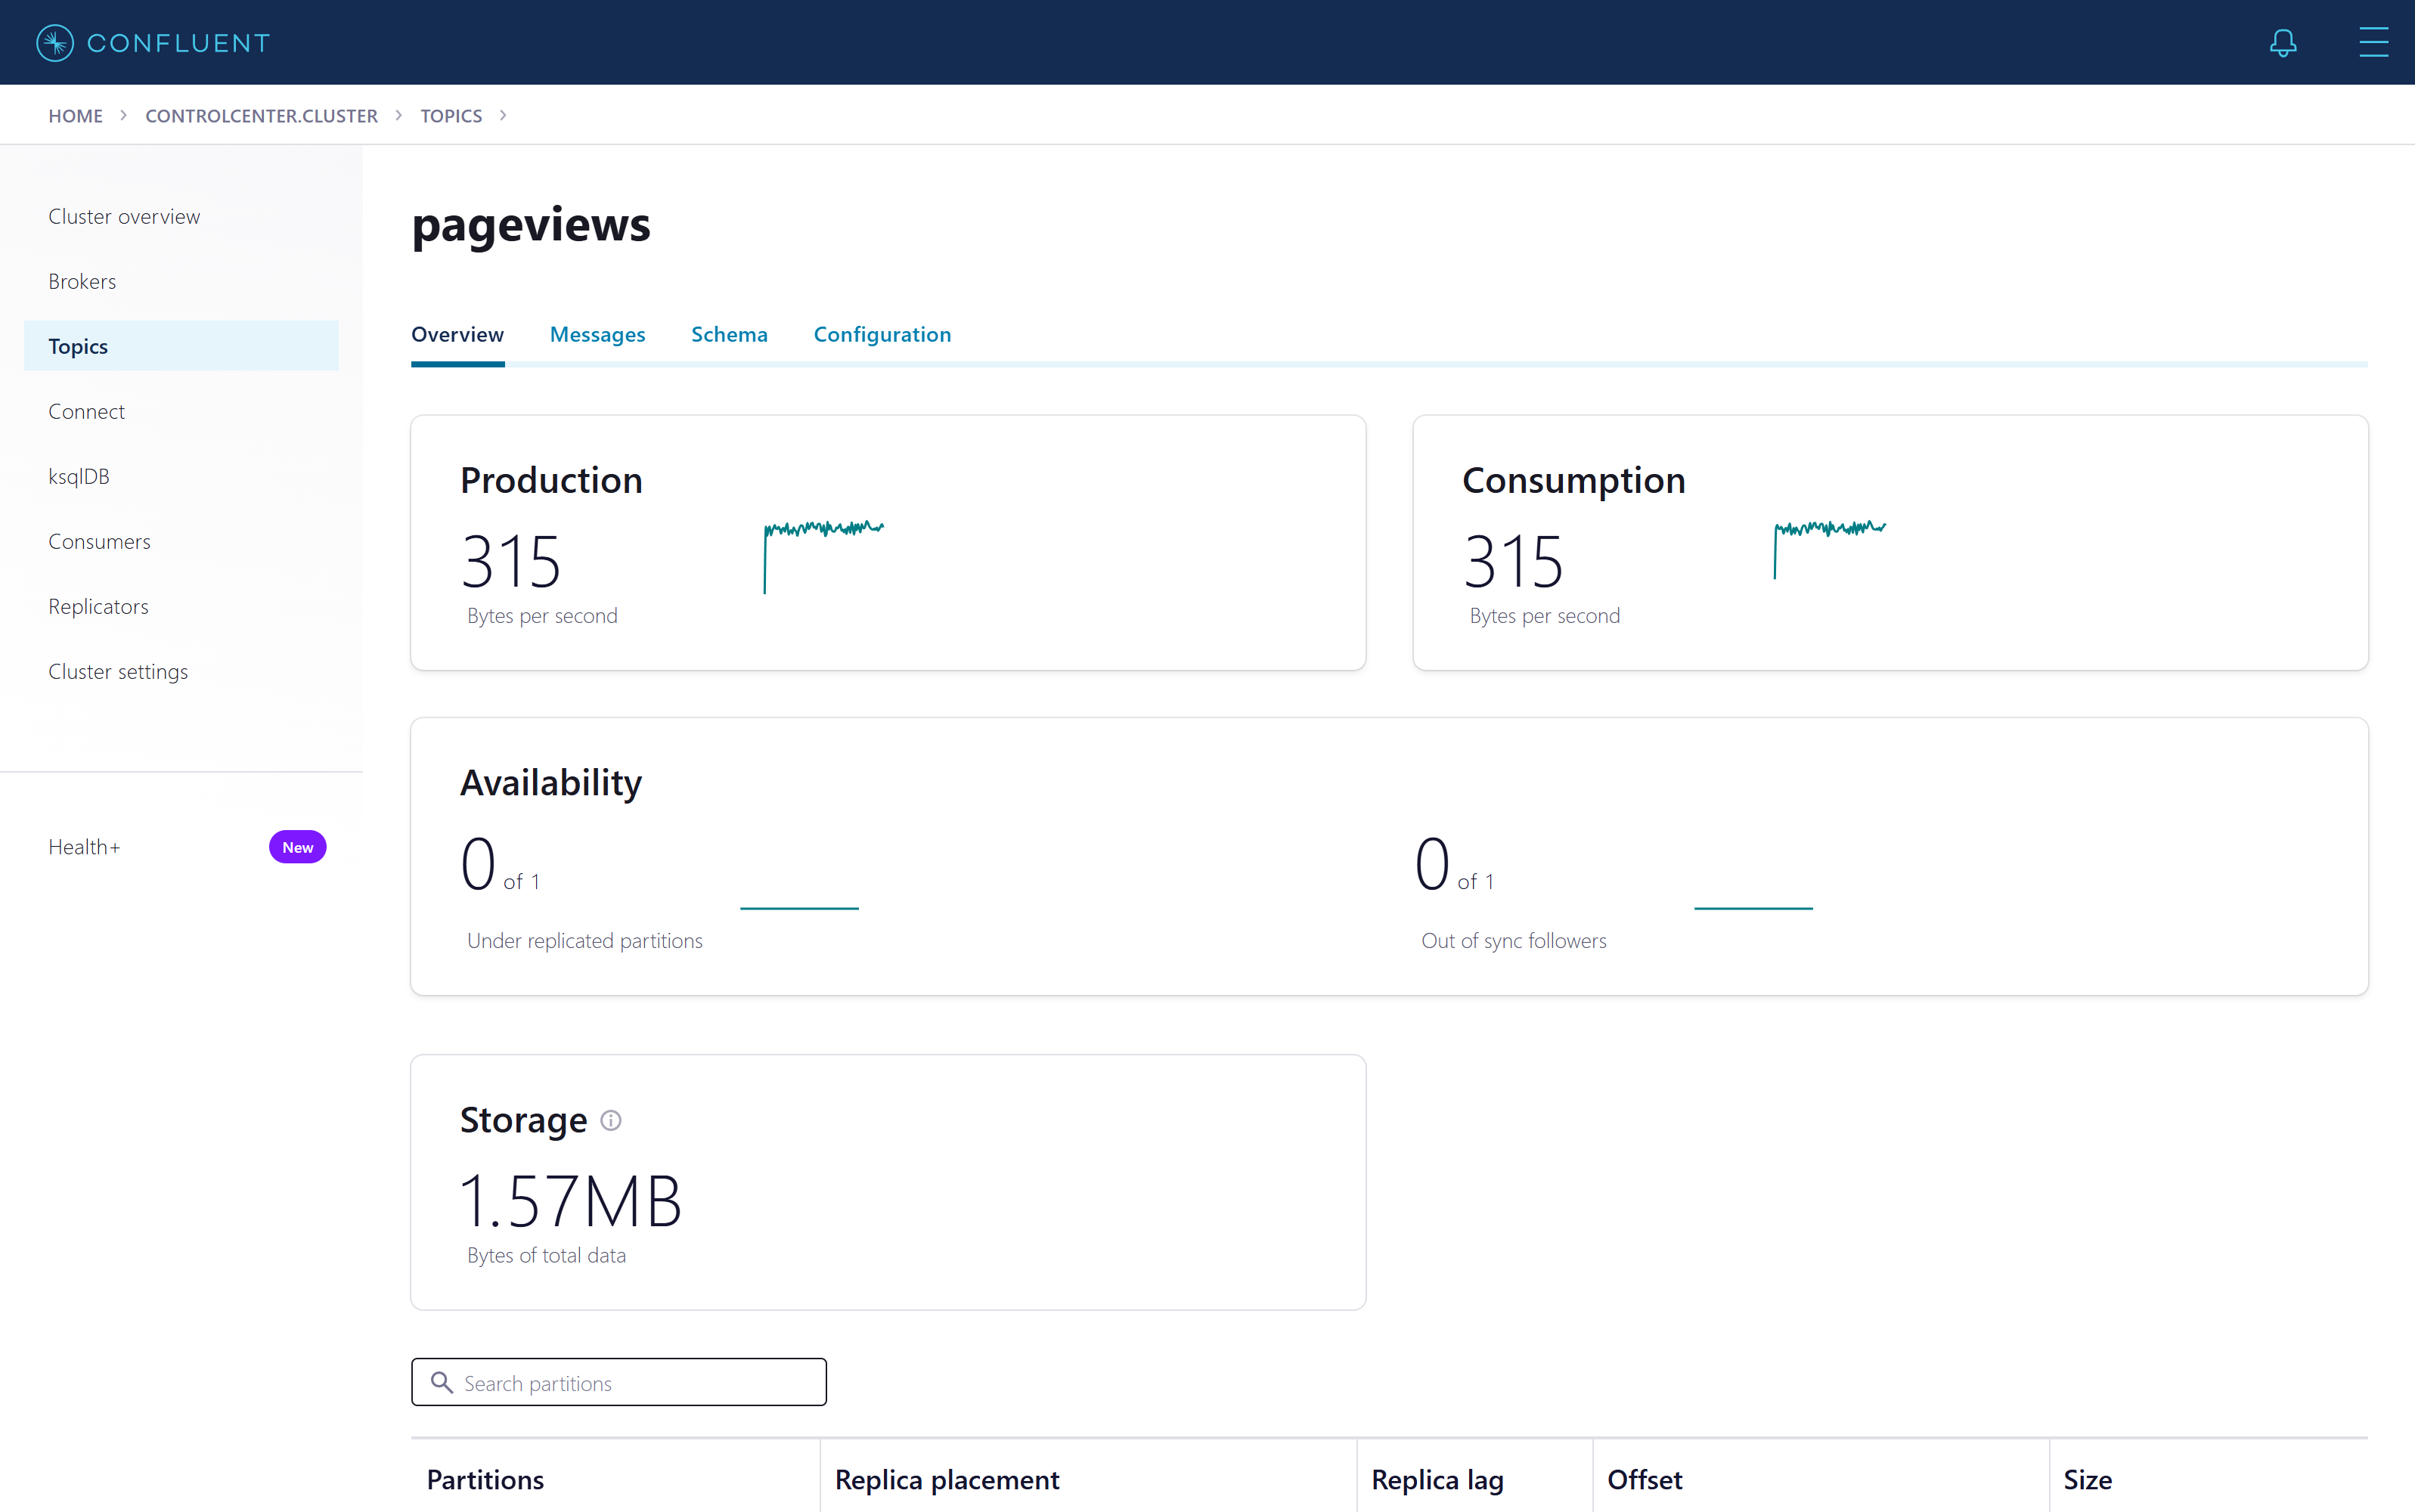
The topic list hides internal topics by default. Each row shows partitions and the produce and consume rates over the
last five minutes. pageviews is both produced and consumed (ksqlDB reads it); users is only
produced, because nothing reads it yet.
Reading messages
The Messages tab is a live tail. Every record has a partition, an offset (its position in that partition, which never changes), a key and a value. Datagen sends one page view per second: a timestamp, a user and a page.
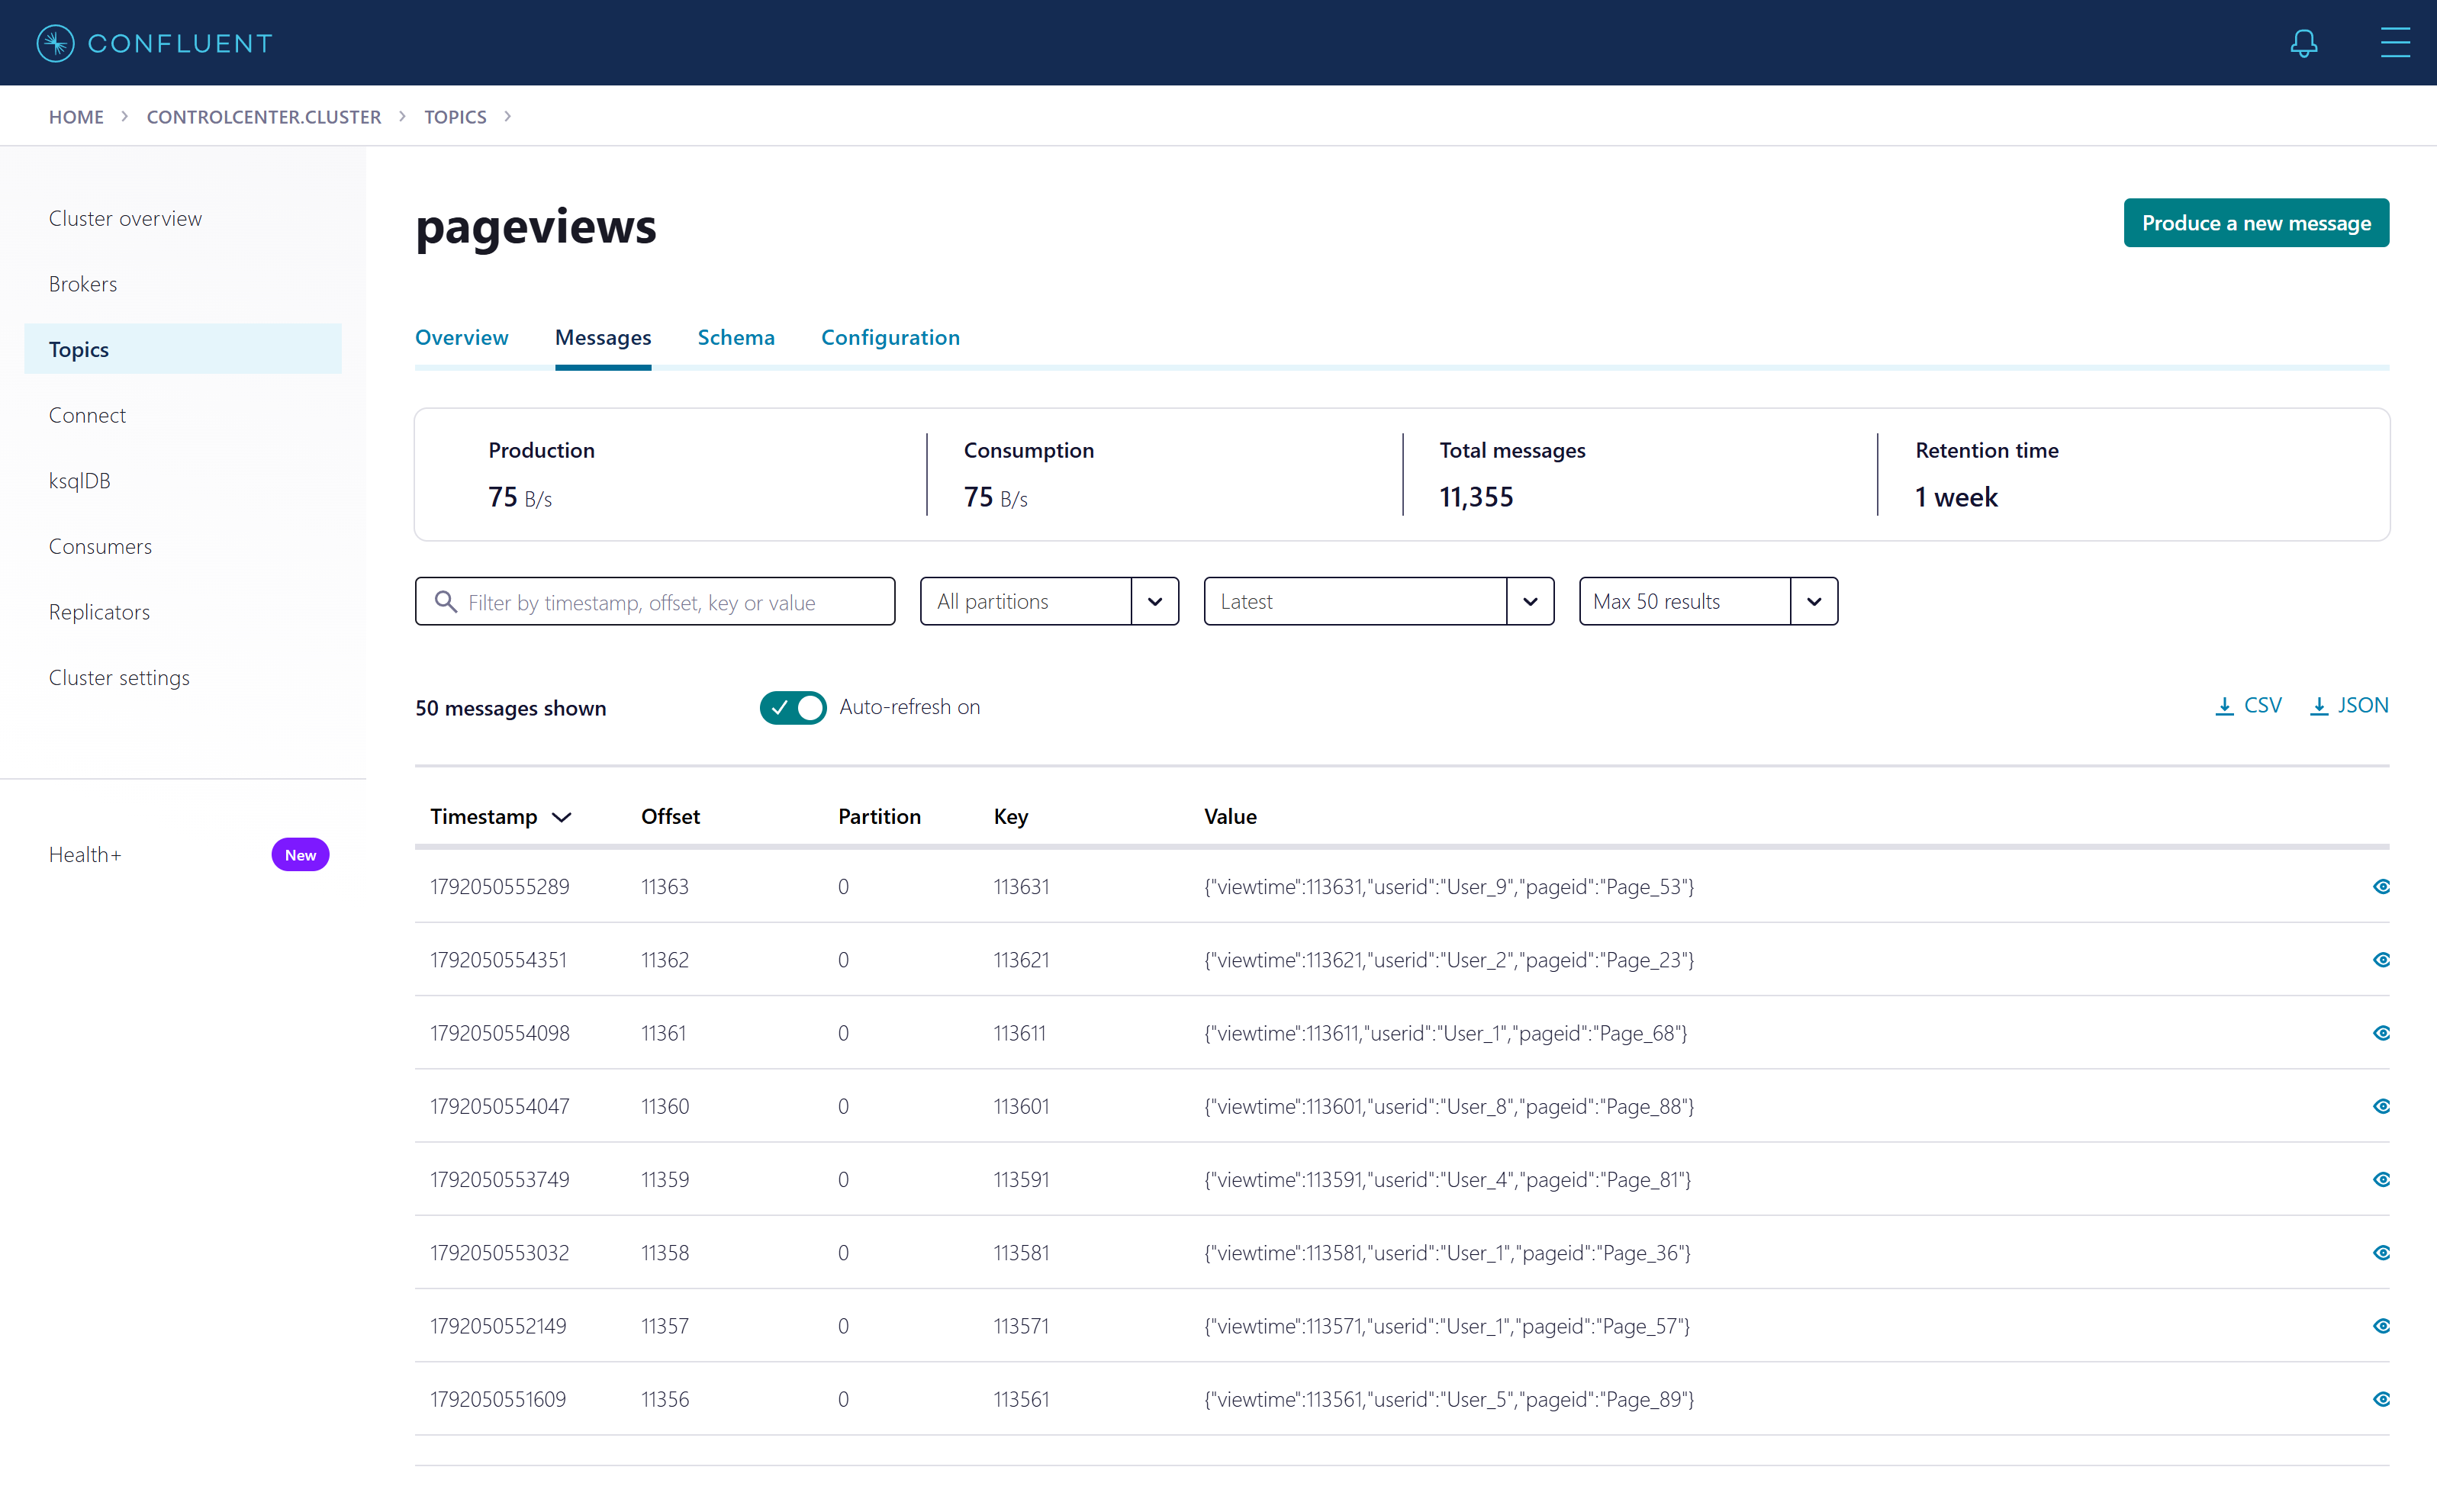
A topic is an append-only log. Consumers do not delete what they read; each consumer group stores its own offset per partition. That is why the same data can feed ksqlDB, a database sink and an analytics job at the same time, and why a new consumer can replay history.
The schema
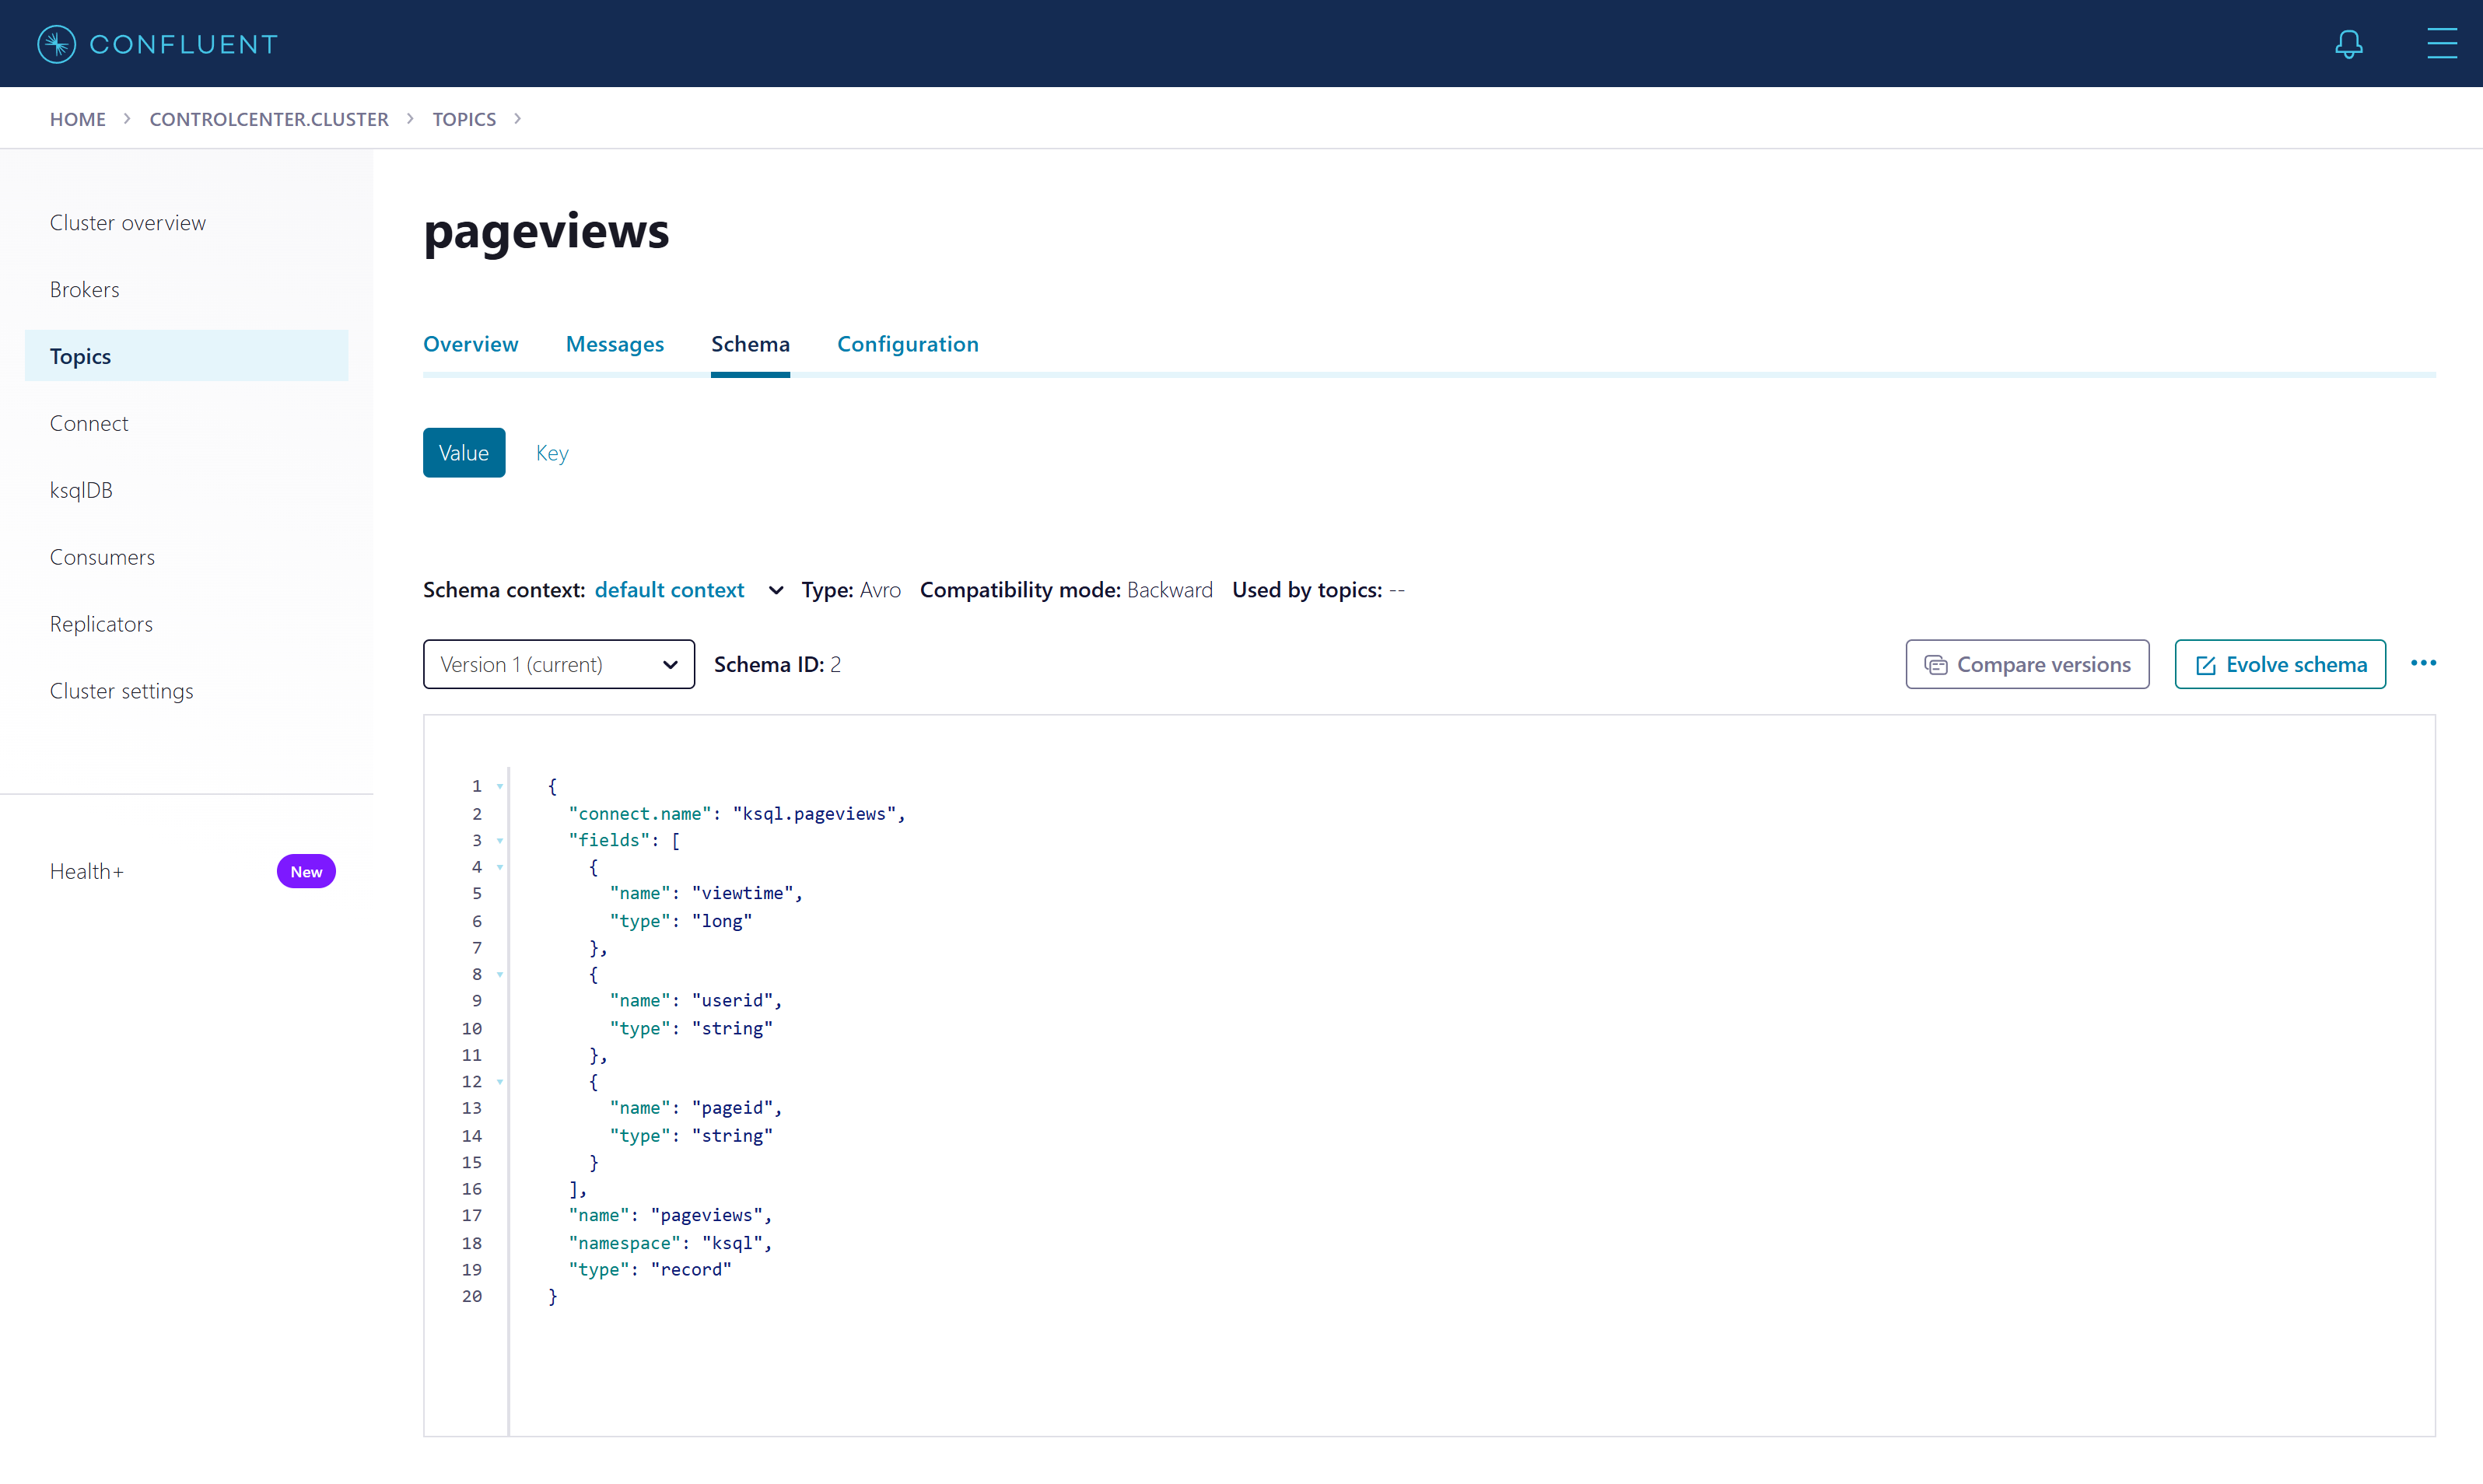
The records on the wire are Avro: compact binary with no field names. The schema lives in Schema Registry under the
subject pageviews-value, and each record carries only the schema id. Compatibility mode
Backward means a new version must still be able to read data written with the previous one, for example by adding
a field with a default.
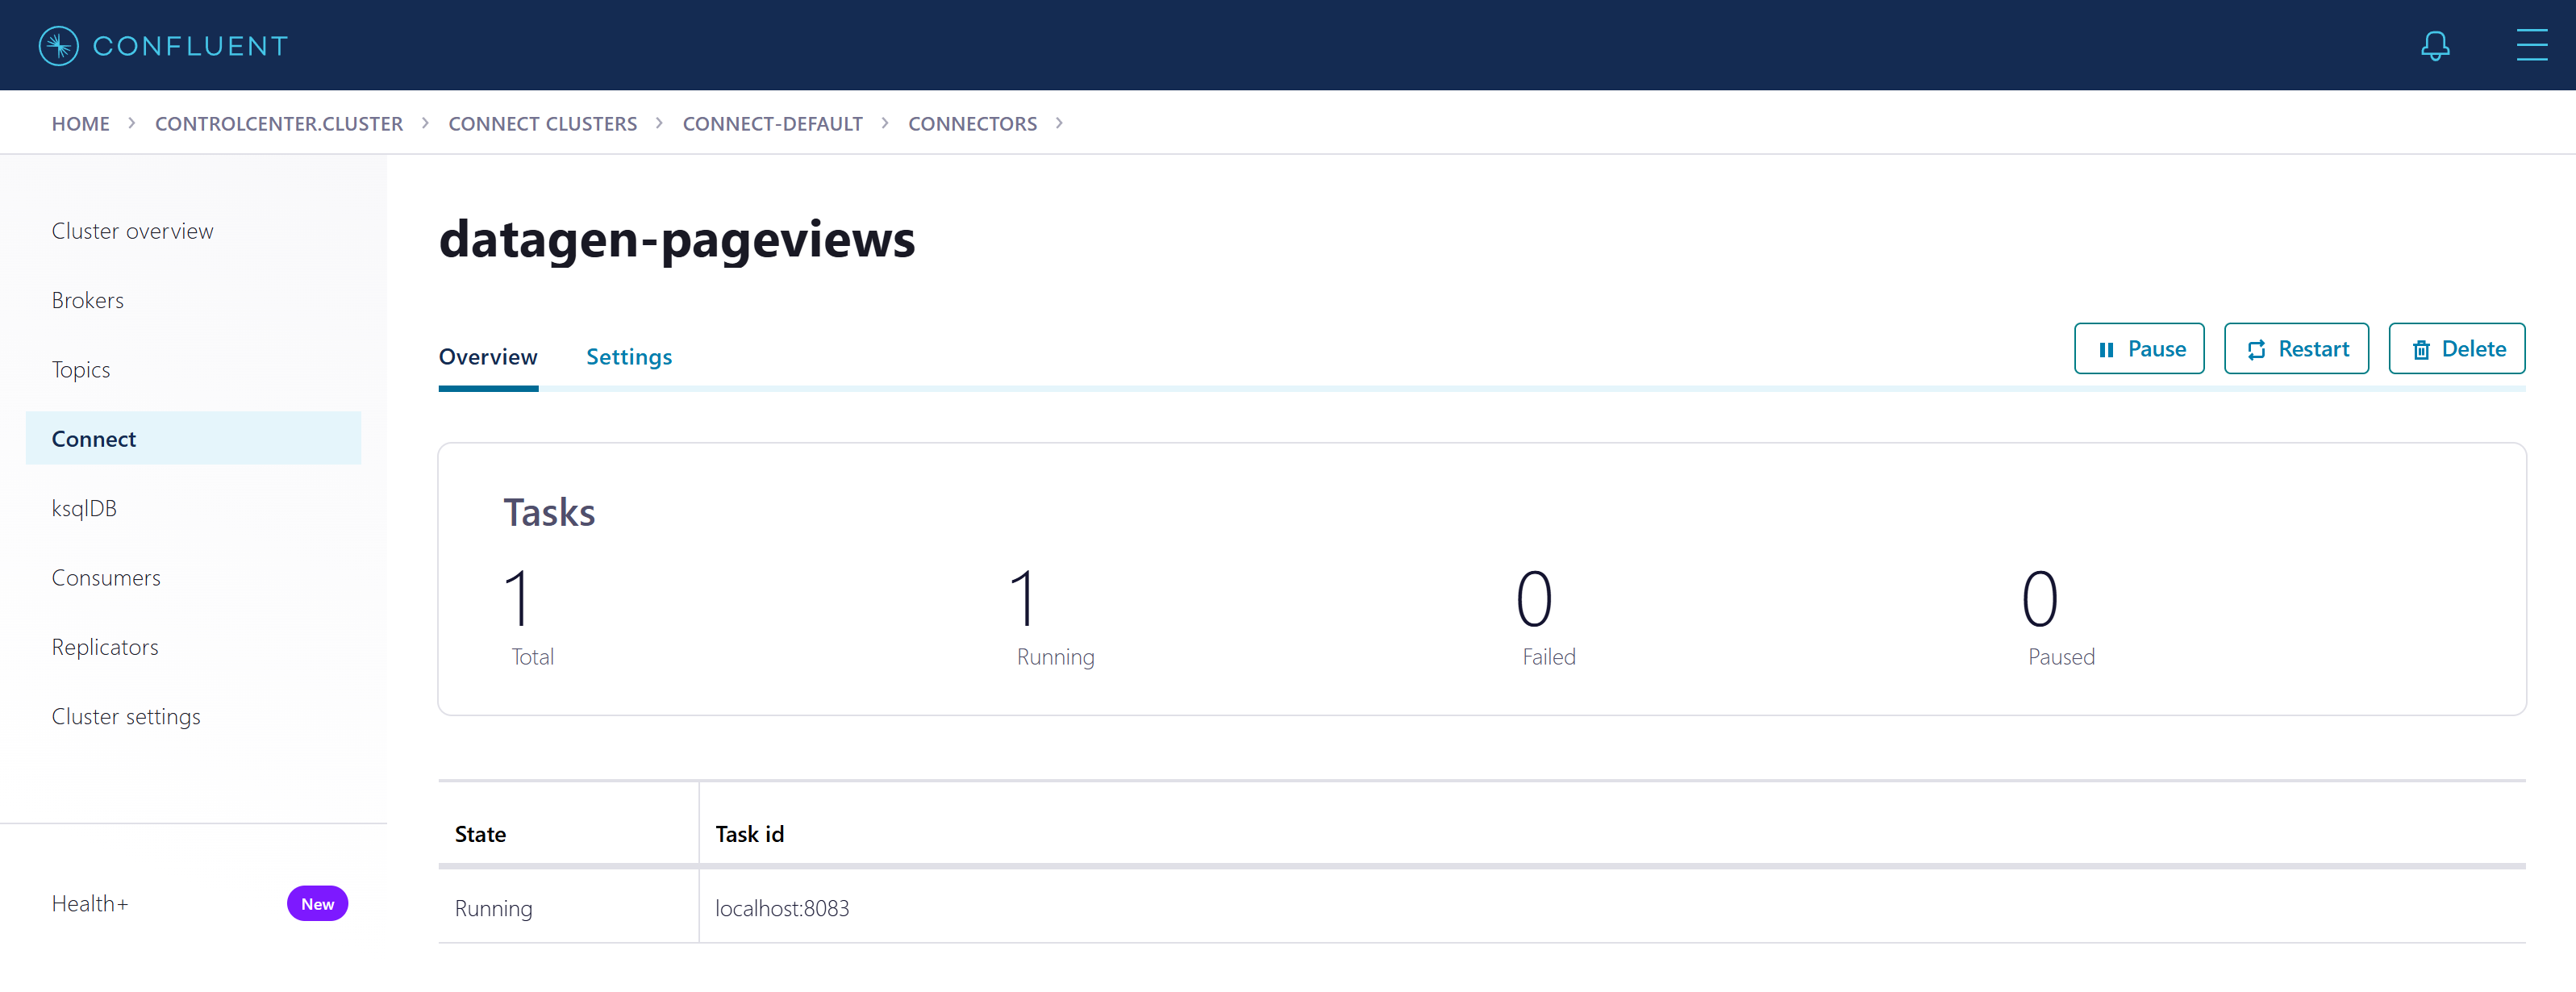
5 · IntegrationKafka Connect: data in without code
Connect is where most real integrations live: a JDBC source reading a database table, a sink writing to Elasticsearch, S3 or another database, a CDC connector streaming every change from a database's log. Each connector is a piece of JSON configuration; Connect runs it, scales it into tasks and restarts it after a failure.
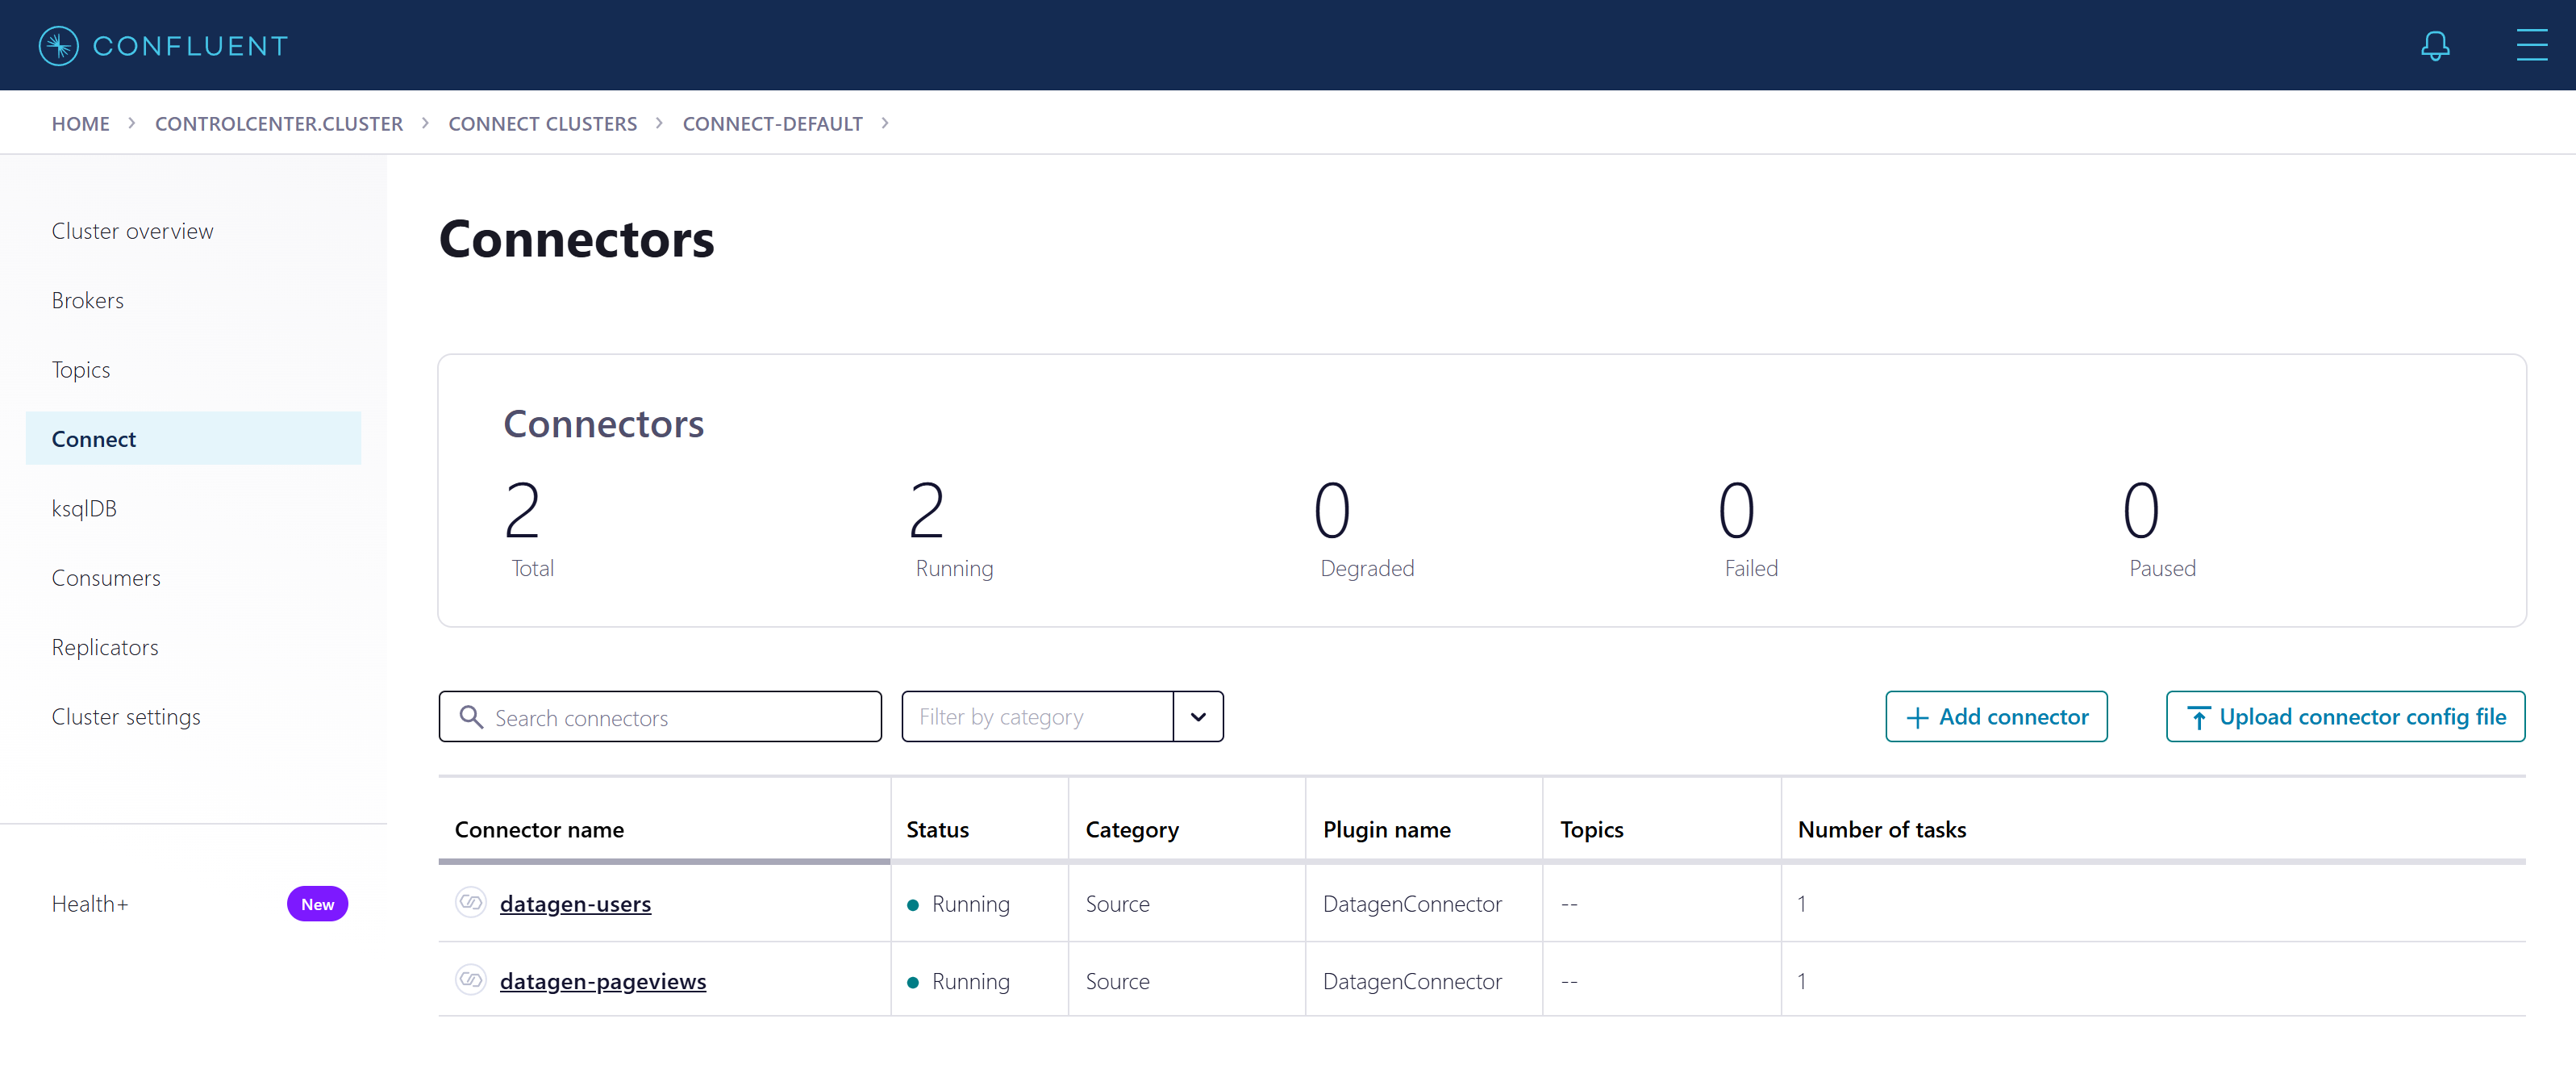
The whole configuration of datagen-pageviews:
{
  "connector.class": "io.confluent.kafka.connect.datagen.DatagenConnector",
  "kafka.topic": "pageviews",
  "quickstart": "pageviews",
  "key.converter": "org.apache.kafka.connect.storage.StringConverter",
  "max.interval": "1000",
  "iterations": "100000000",
  "tasks.max": "1"
}
There is no value converter here: the worker's default, AvroConverter, registers the schema in Schema
Registry and serialises each record. Swap the connector class and its settings and the same pattern reads from a real
system.
6 · ProcessingksqlDB: SQL over a stream
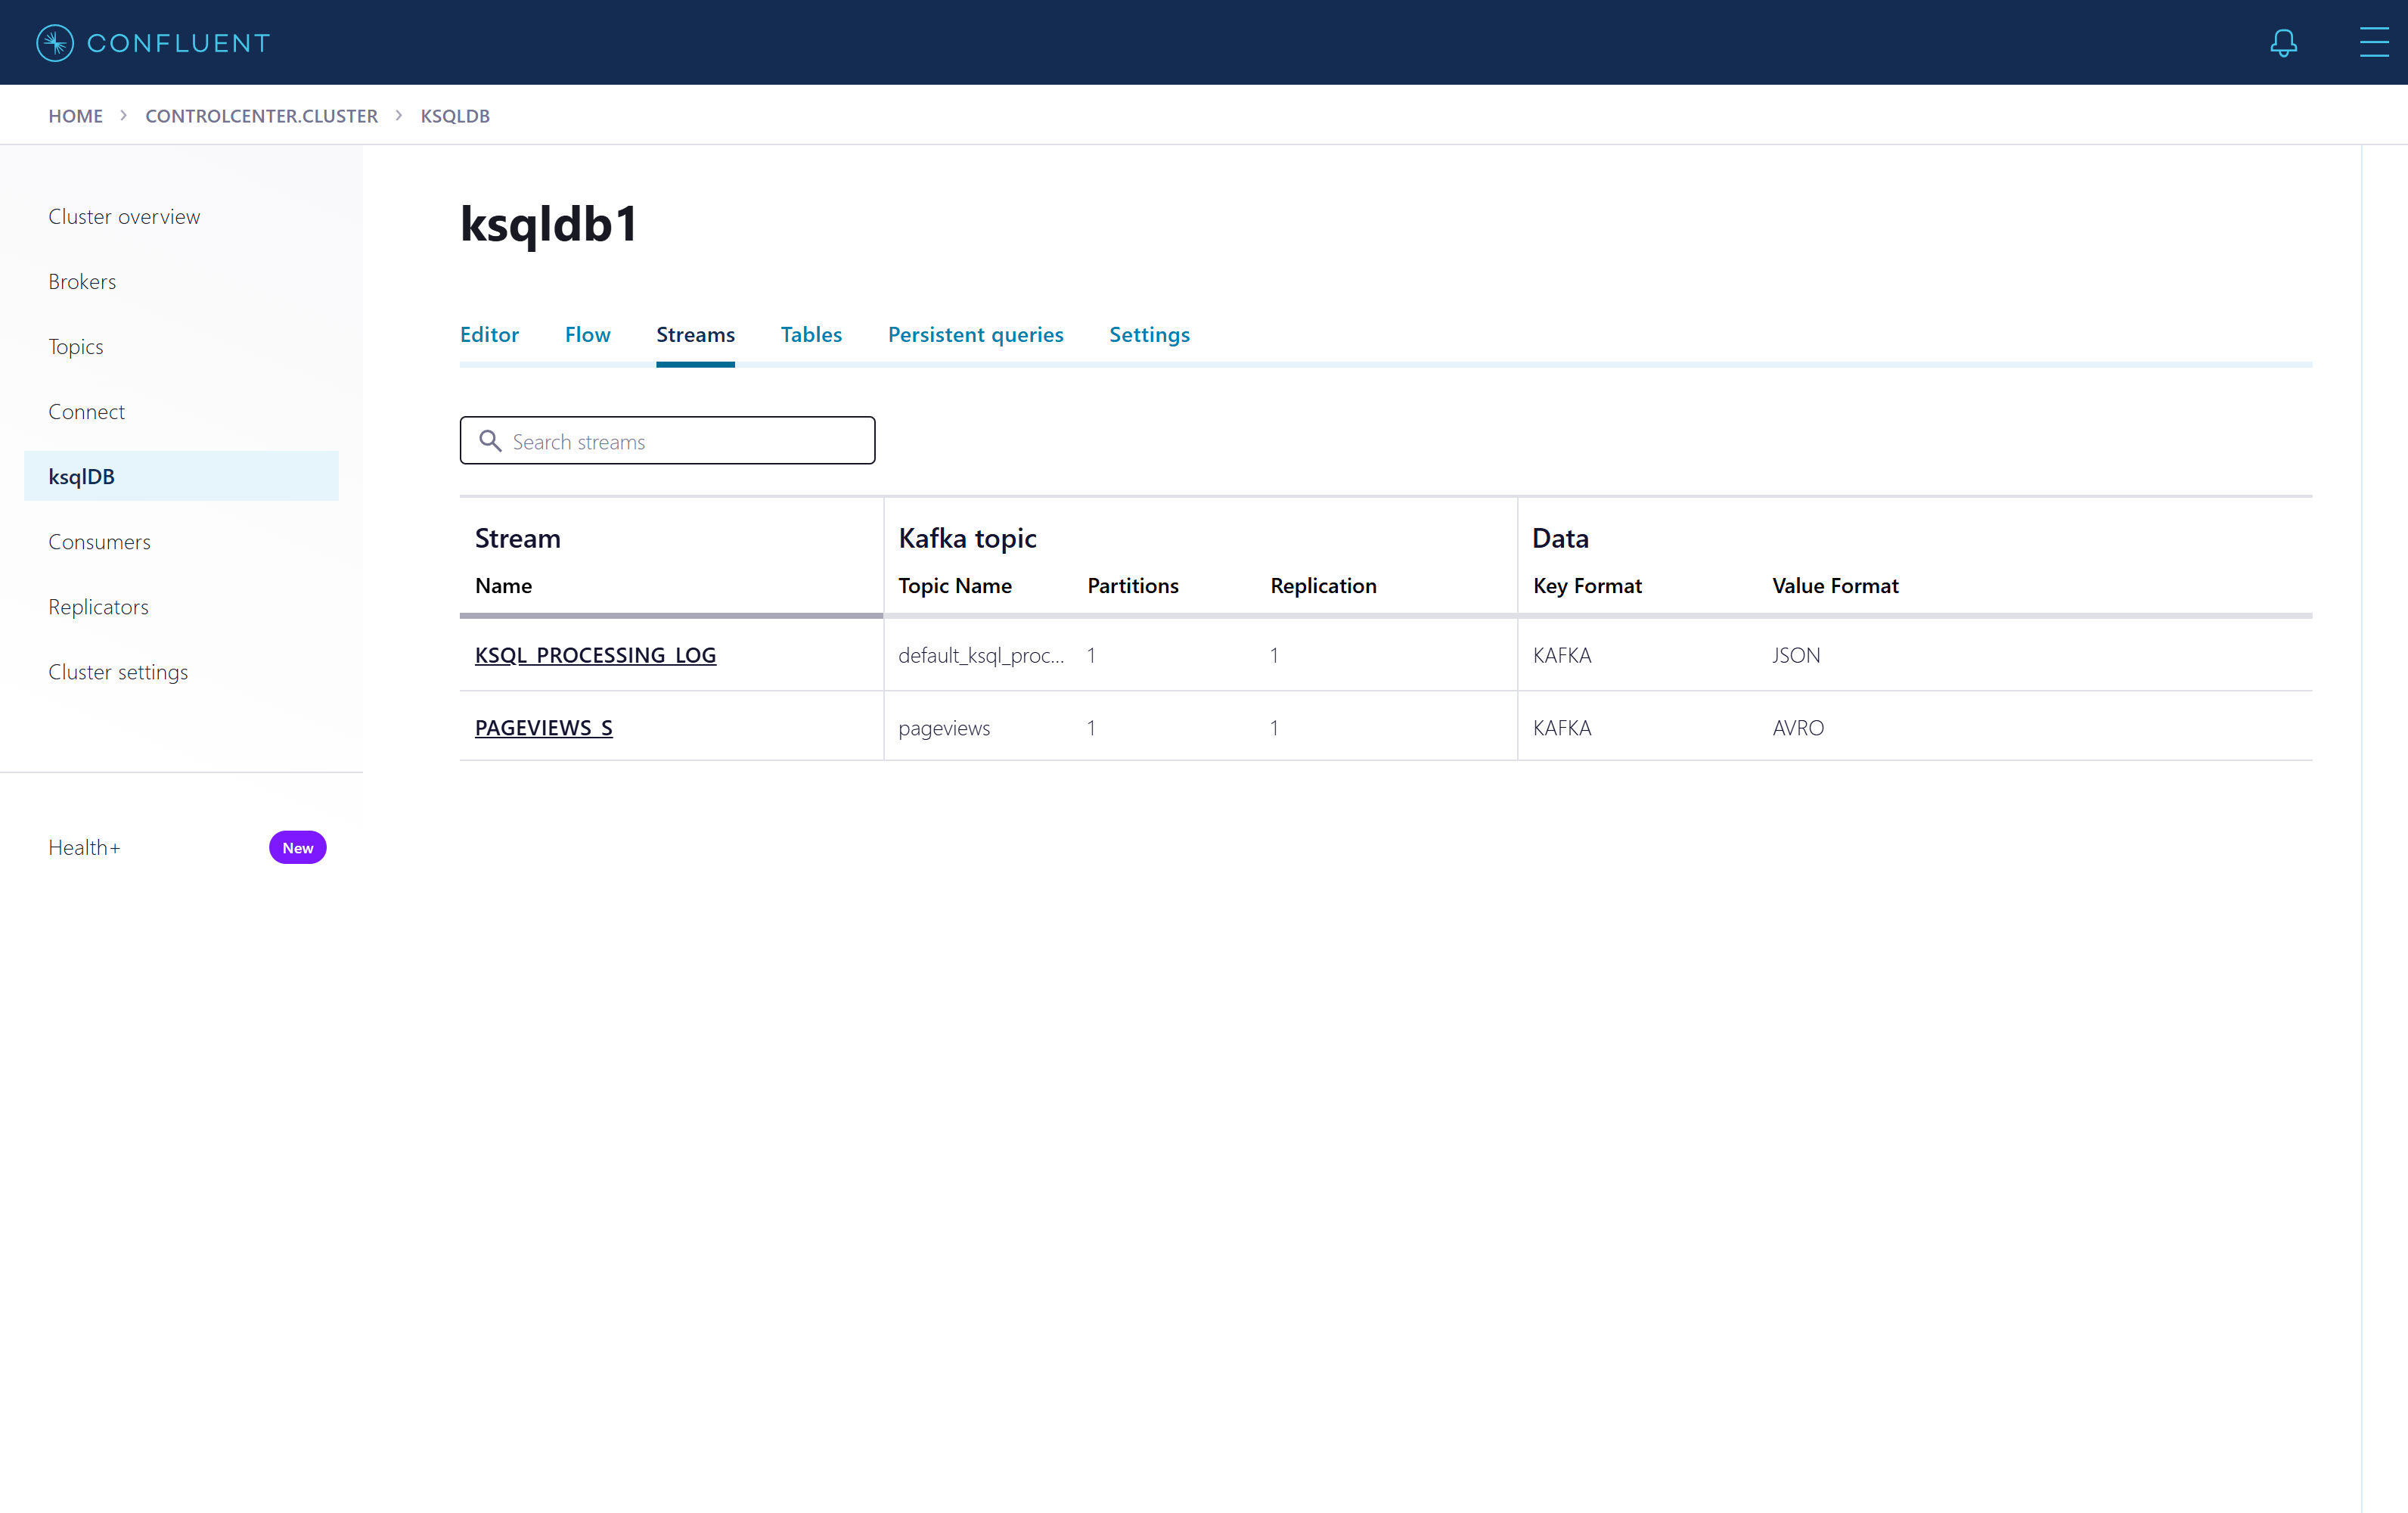
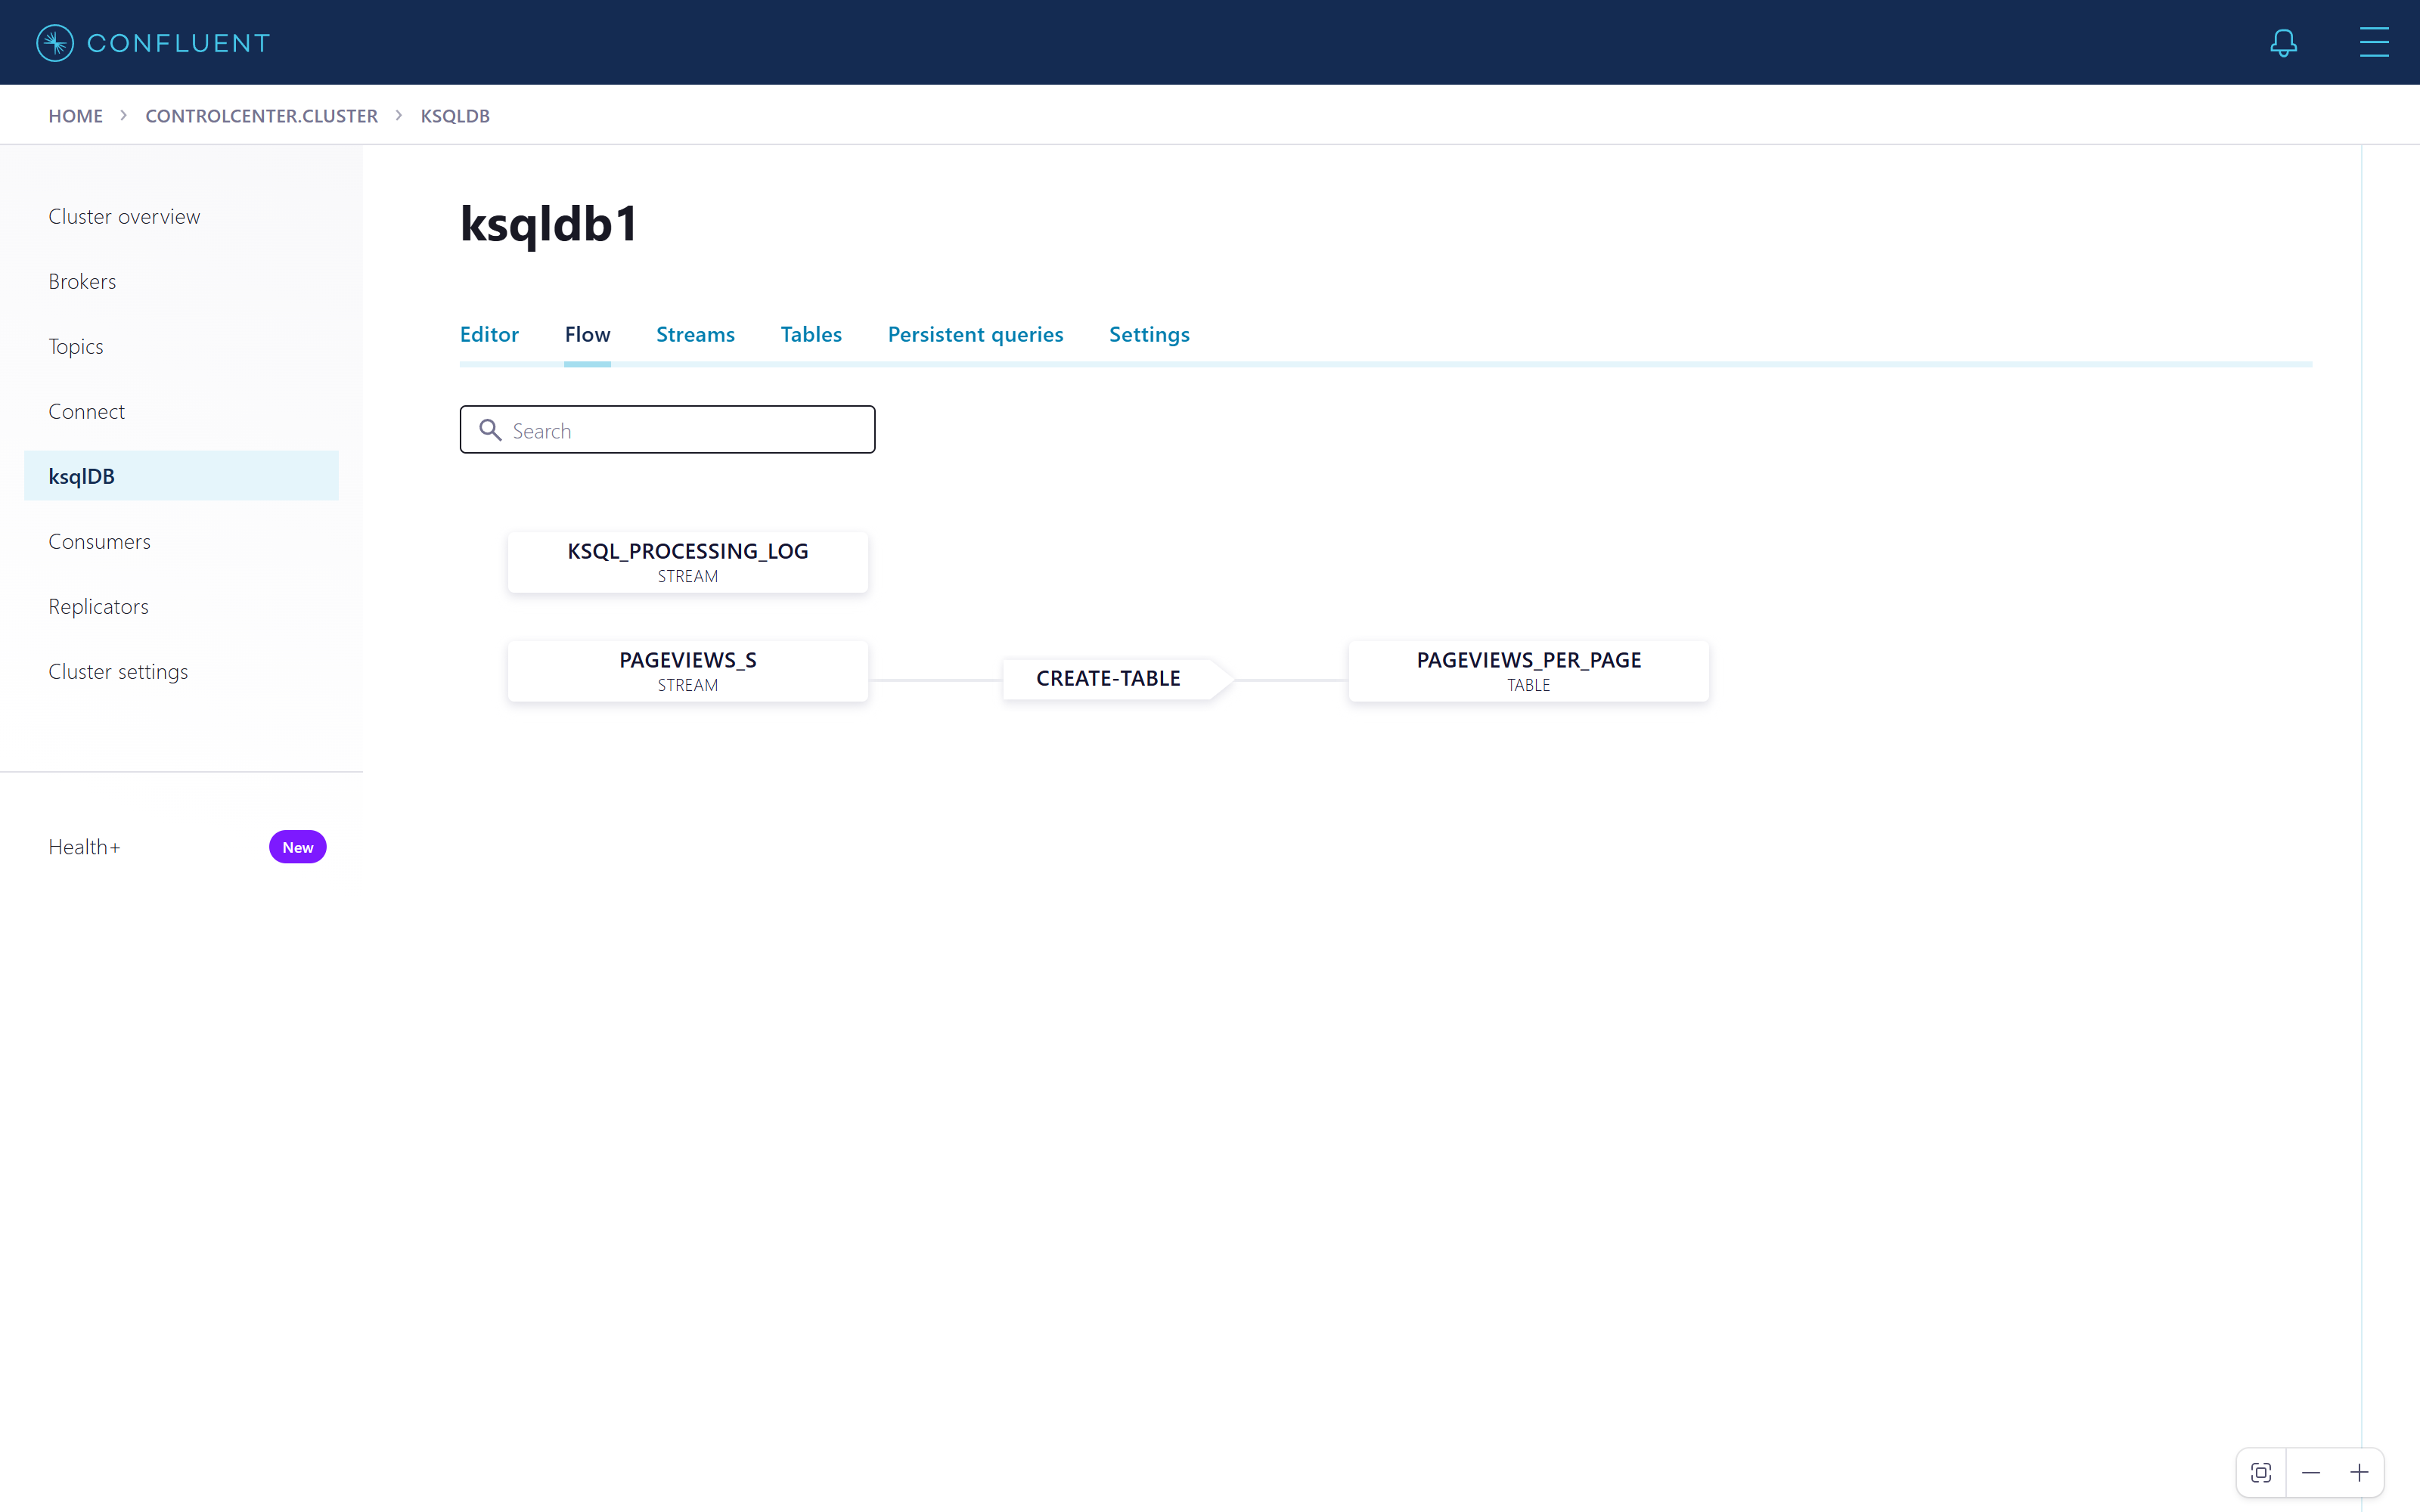
ksqlDB has two kinds of objects. A stream is the topic seen as an unbounded series of events: every page view is a new row. A table is the latest value per key: one row per page, updated as events arrive. Two statements build the pipeline:
CREATE STREAM PAGEVIEWS_S WITH (KAFKA_TOPIC='pageviews', VALUE_FORMAT='AVRO');

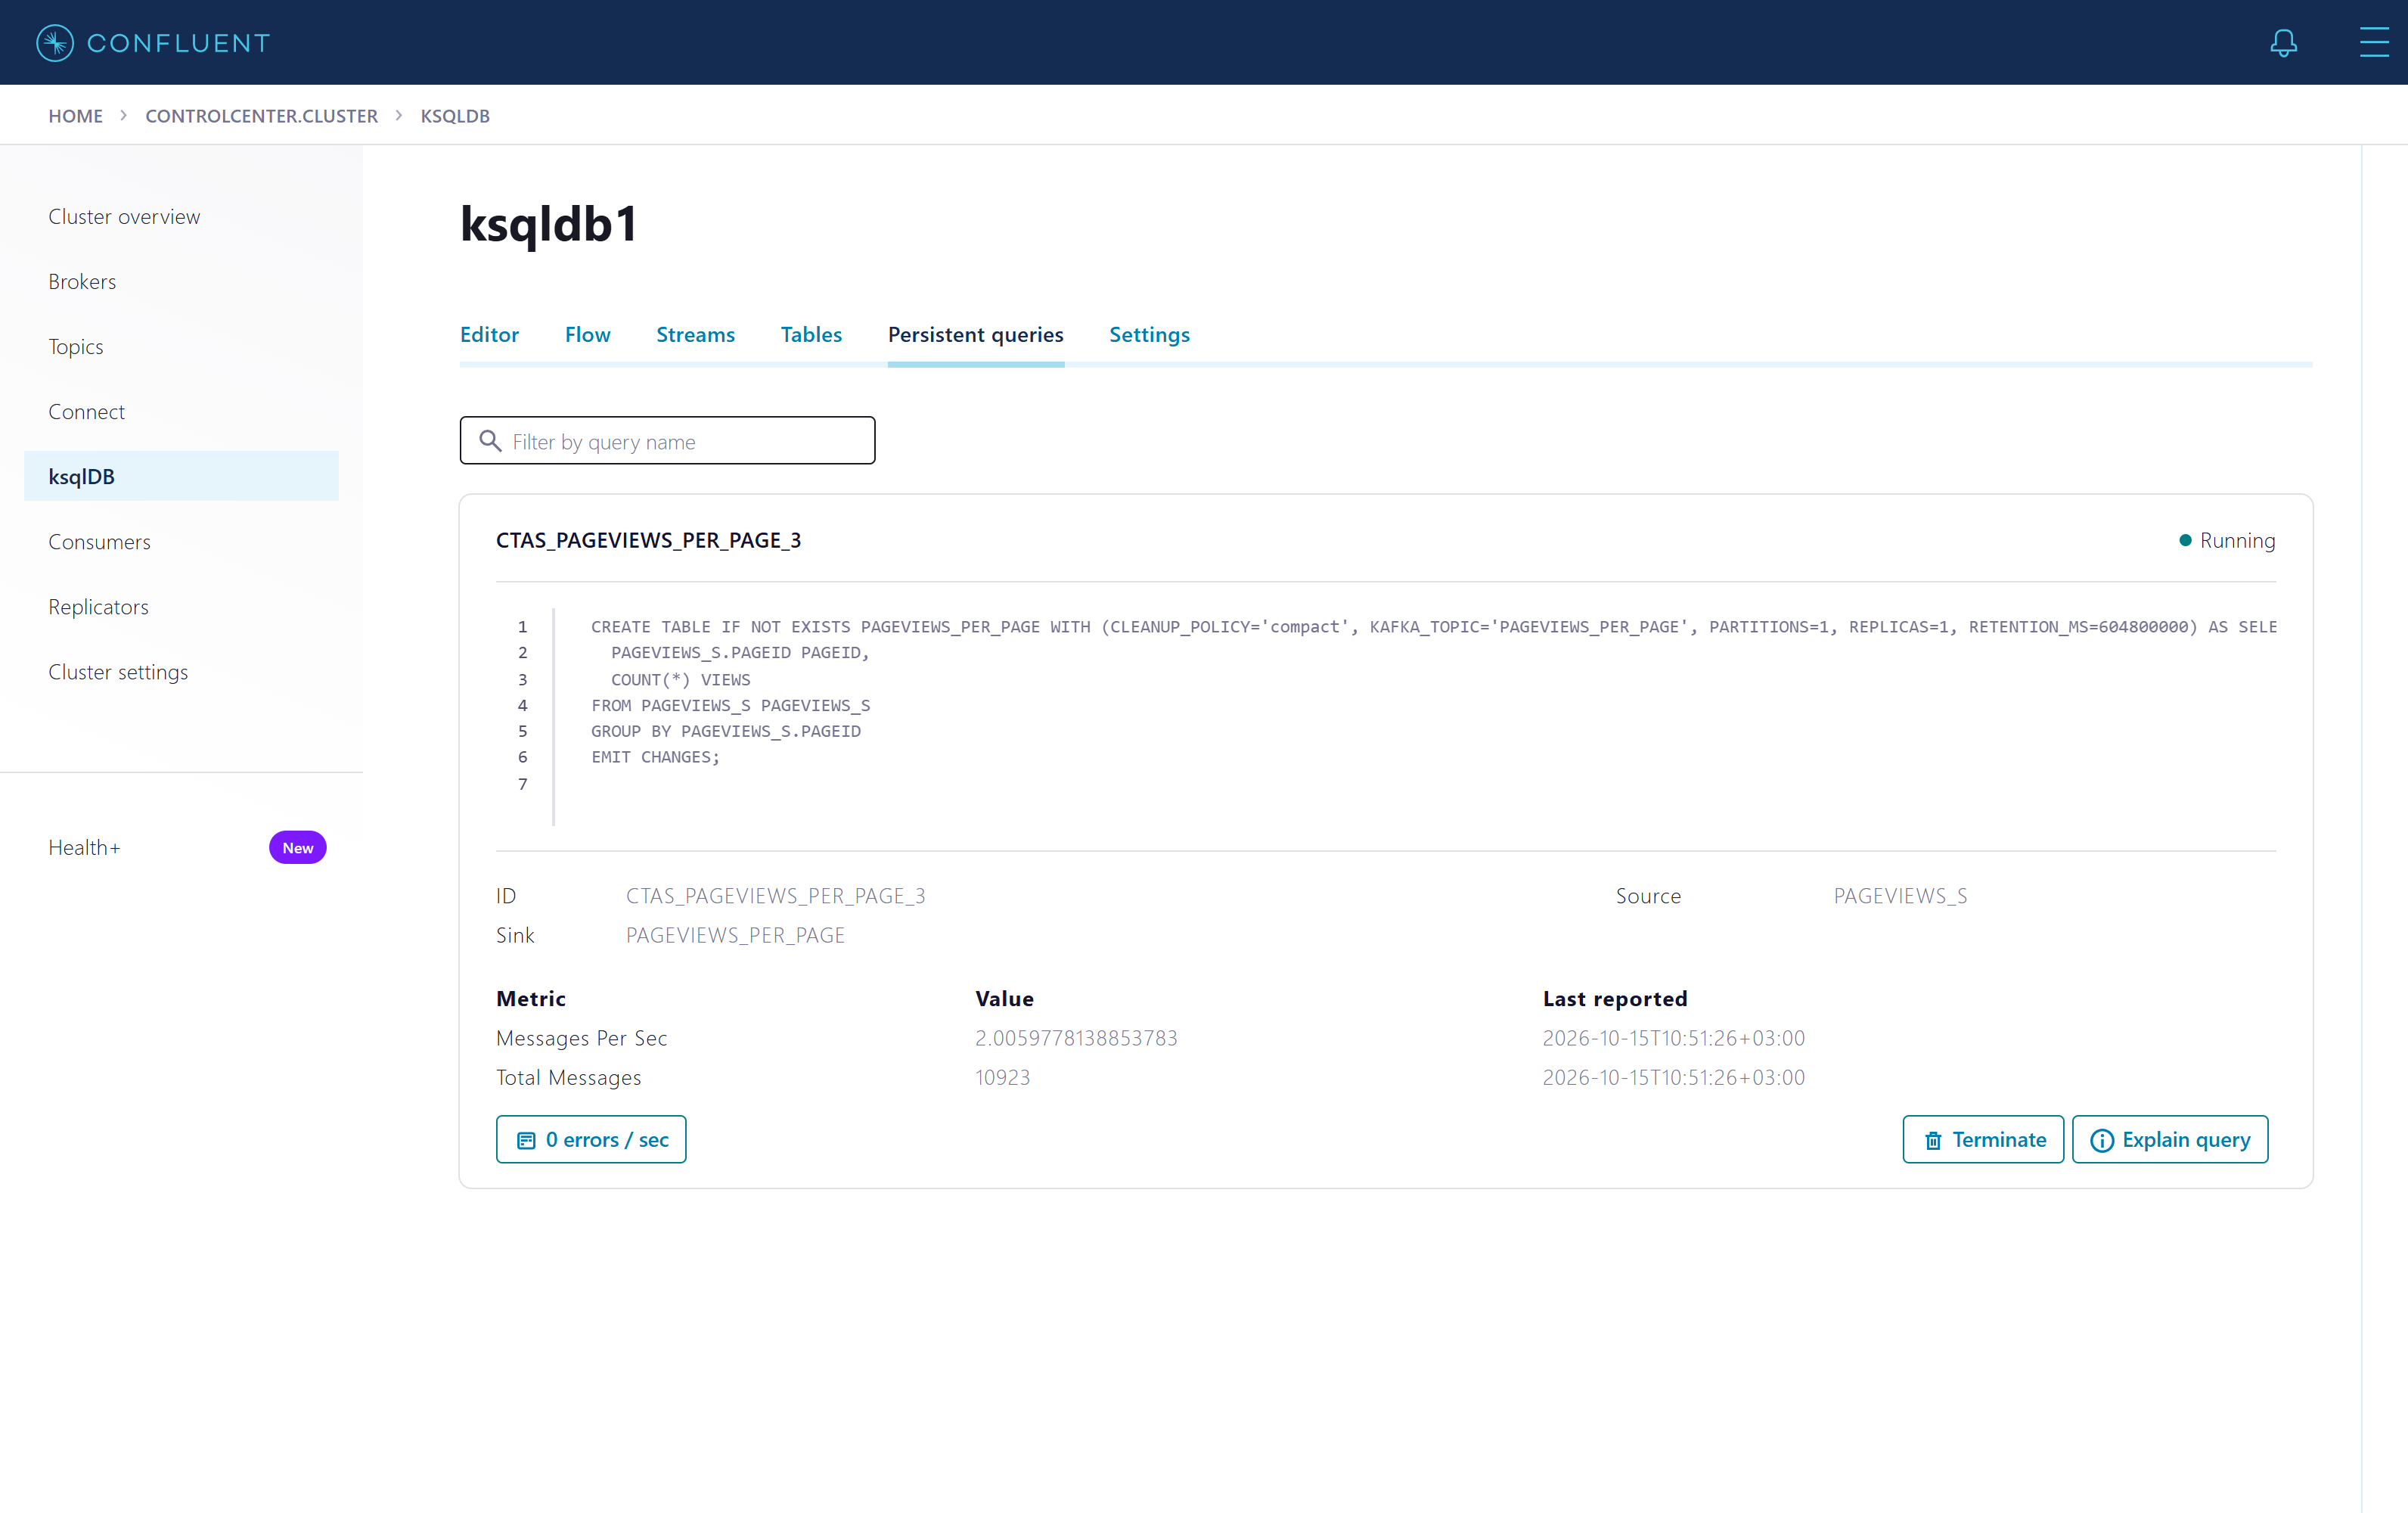
CREATE TABLE PAGEVIEWS_PER_PAGE AS
  SELECT PAGEID, COUNT(*) AS VIEWS
  FROM PAGEVIEWS_S
  GROUP BY PAGEID
  EMIT CHANGES;
The stream needs no column list: ksqlDB reads the fields from Schema Registry. The table is a persistent
query. It keeps running after the statement returns, writes each new count to a compacted topic called
PAGEVIEWS_PER_PAGE, and survives restarts.
Querying the table
A push query (EMIT CHANGES) stays open and sends every change as it happens. A pull
query (no EMIT CHANGES) returns the current value and ends, like a lookup in a database:
-- push: every new count, as it changes
SELECT PAGEID, VIEWS FROM PAGEVIEWS_PER_PAGE EMIT CHANGES;

-- pull: the current count for one page, then done
SELECT VIEWS FROM PAGEVIEWS_PER_PAGE WHERE PAGEID = 'Page_18';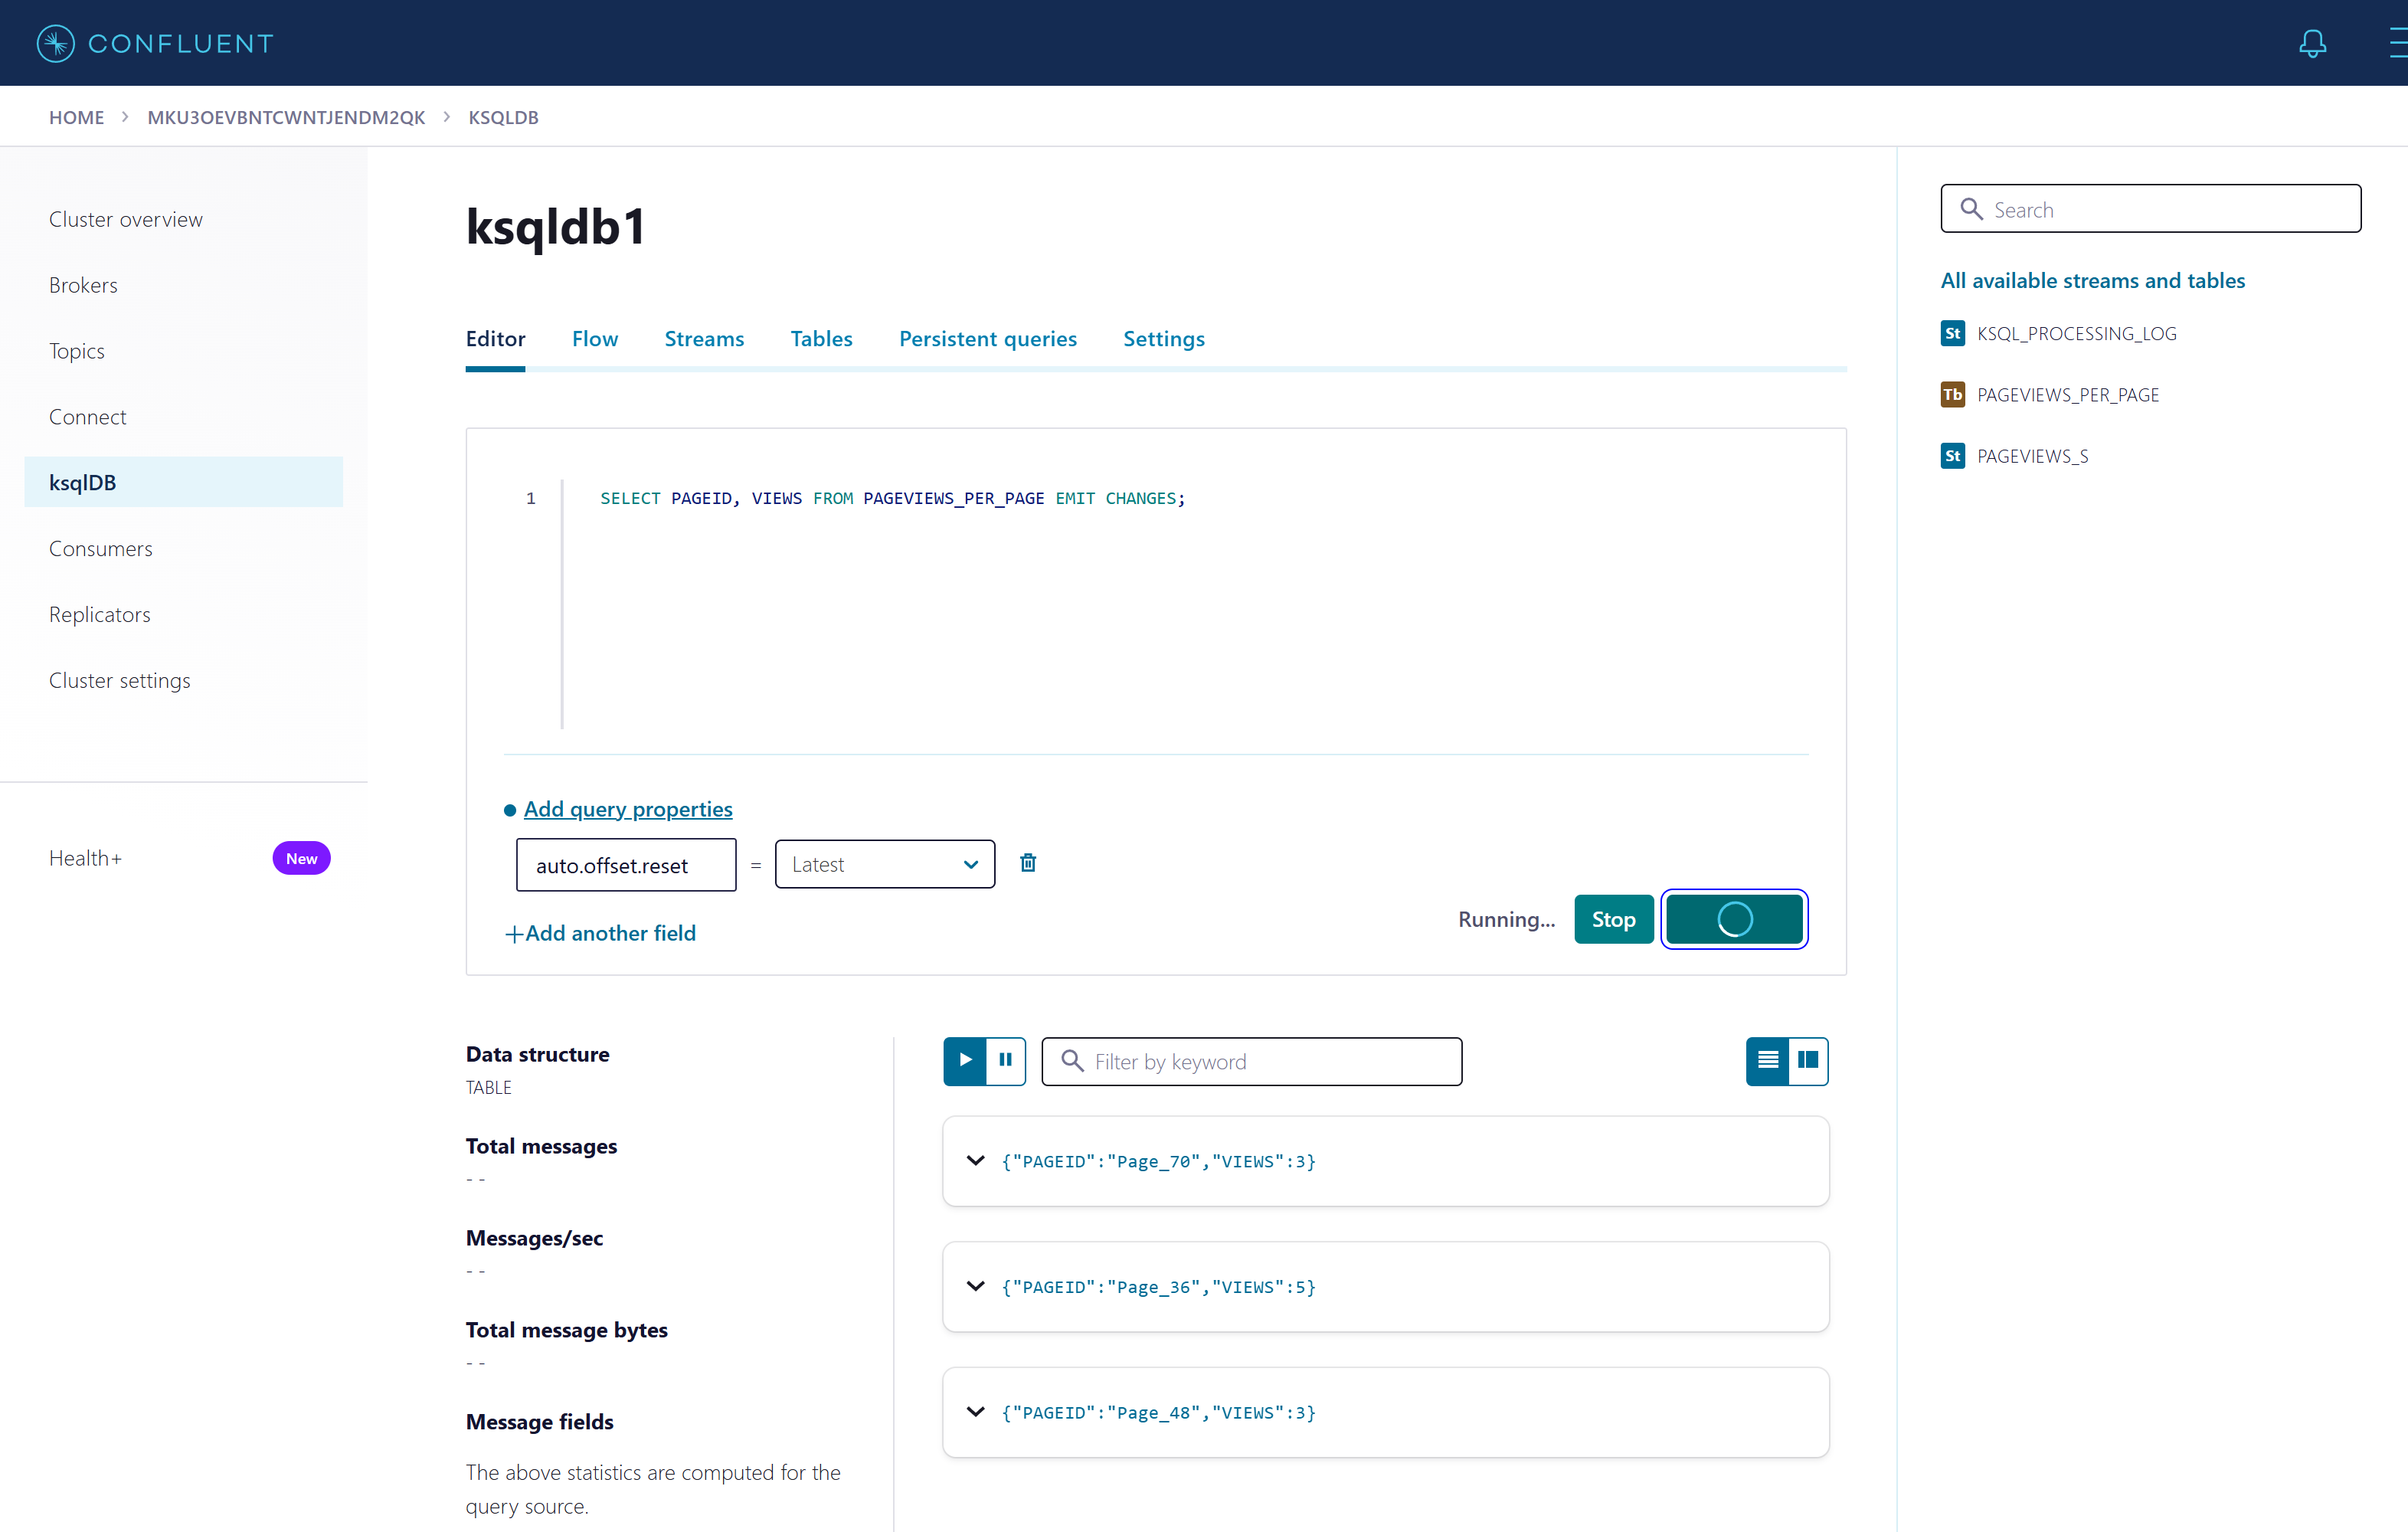
The table is a materialised view that is never stale and never recomputed from scratch. The same pattern counts alarms per asset, totals meter readings per hour or flags a sensor that has gone quiet, all as the events arrive.
7 · OperationsConsumer groups and lag
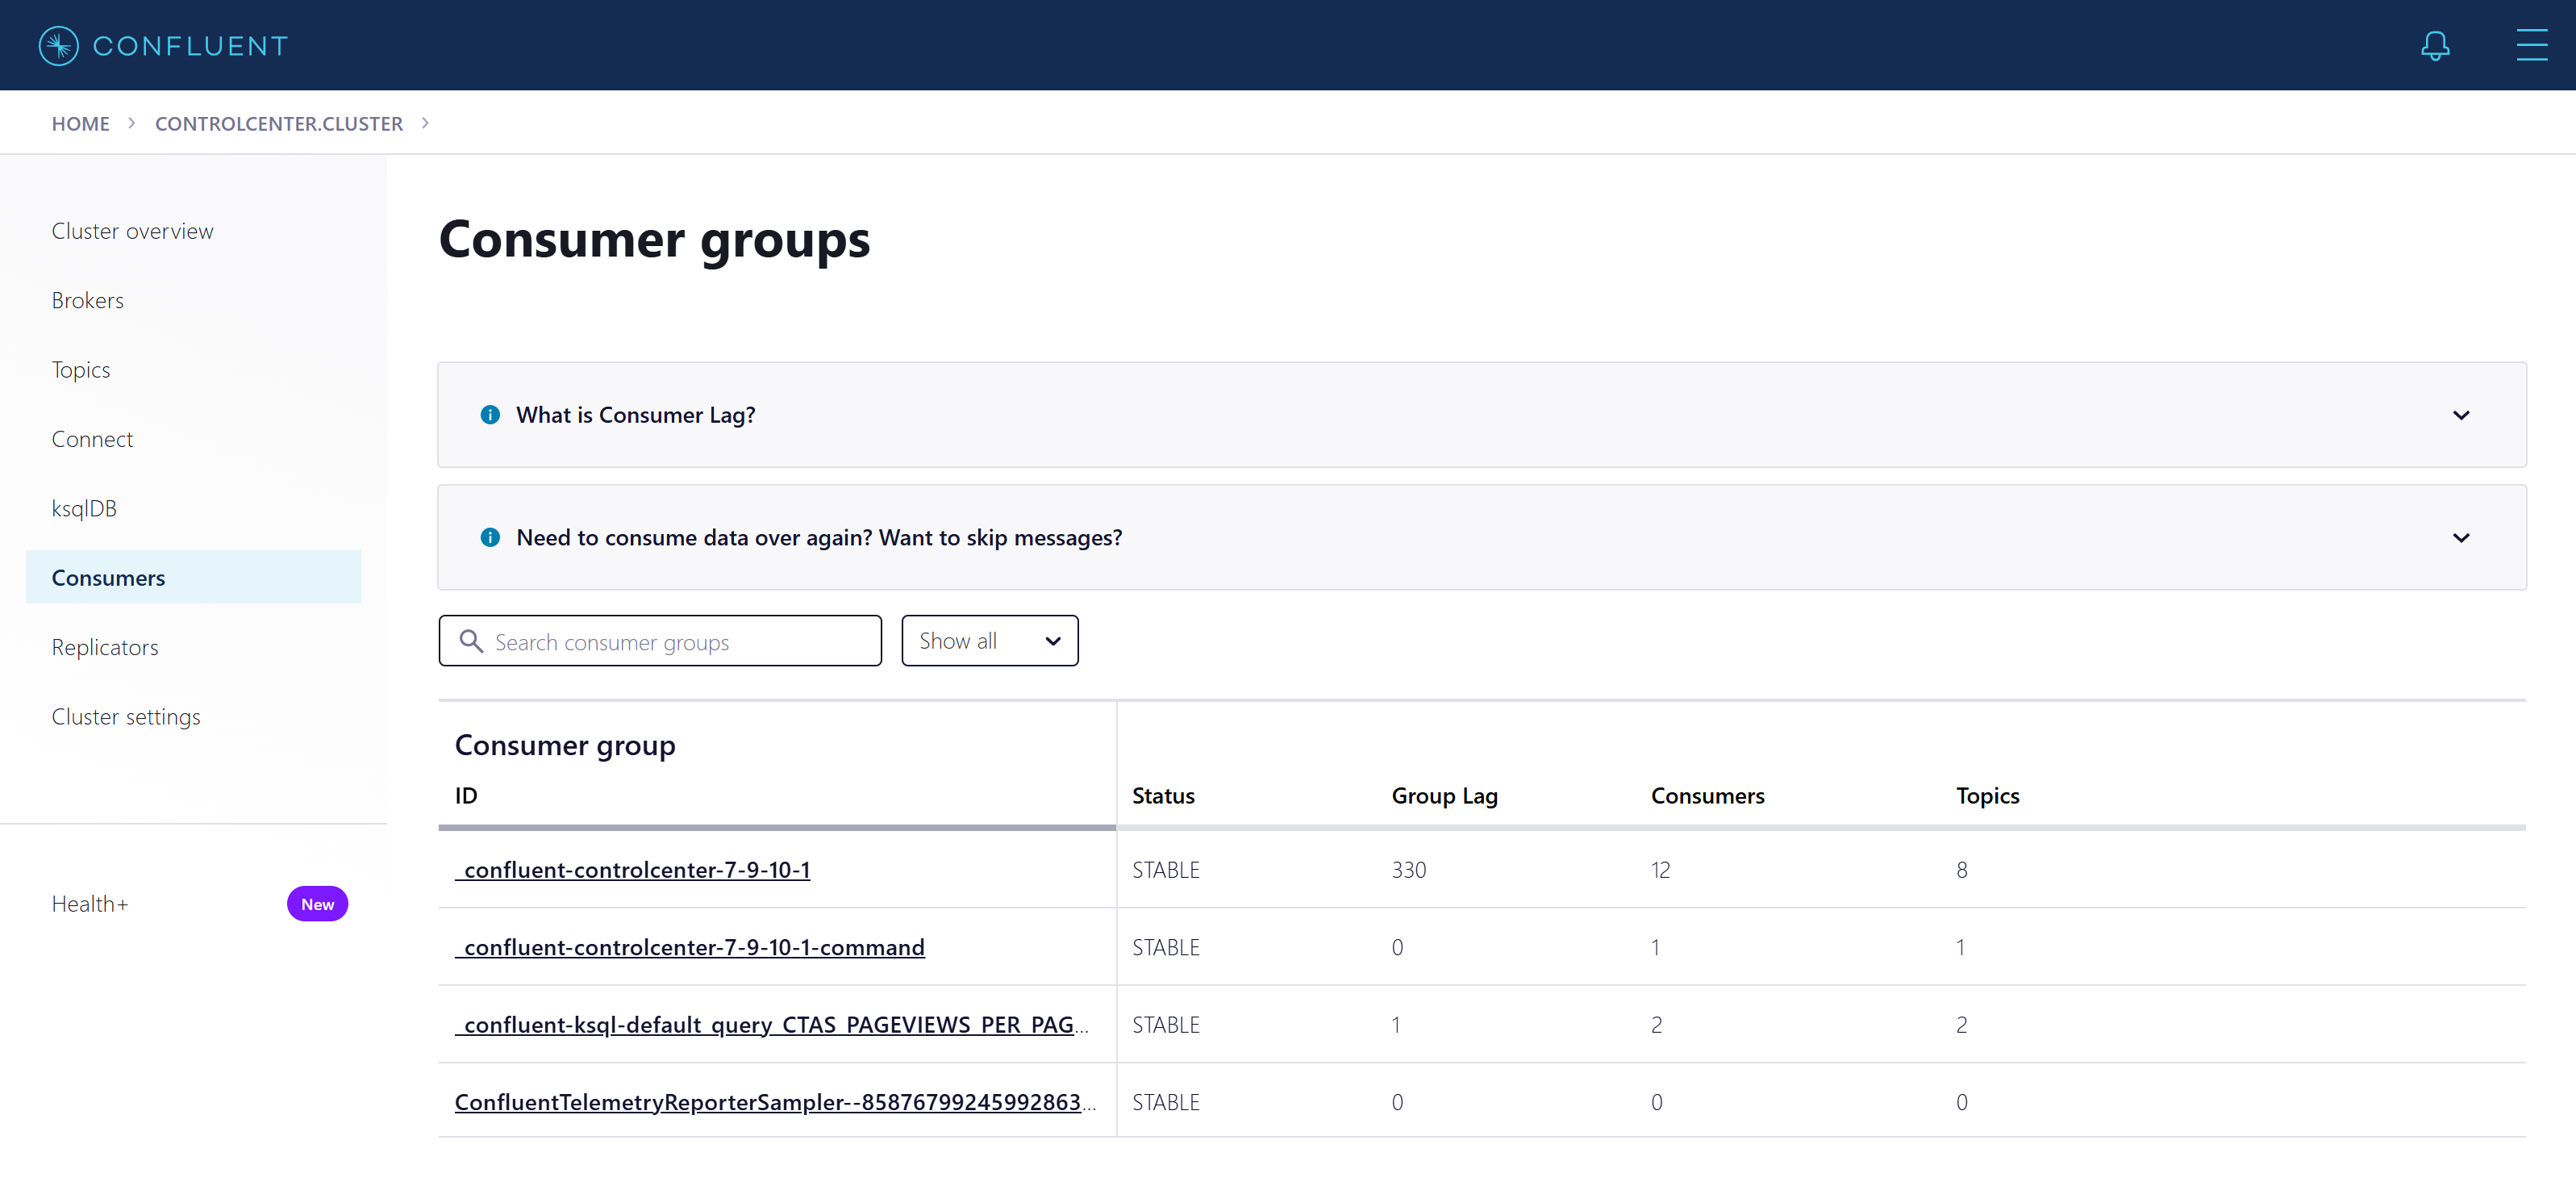
Every application that reads a topic does so as a consumer group. Lag is how far behind the group is: the latest offset in the partition minus the offset the group has committed. Steady lag is normal; lag that only grows means the consumer cannot keep up or has stopped.
8 · Hands-onTry it from the command line
The REST APIs are what Control Center calls. On the host running the pod (the ports are not published to the internet):
# connectors and their state
curl -s localhost:8083/connectors?expand=status

# schema subjects
curl -s localhost:8081/subjects

# produce one JSON record through the REST Proxy
curl -s -X POST localhost:8082/v3/clusters/MkU3OEVBNTcwNTJENDM2Qk/topics/demo/records \
  -H 'Content-Type: application/json' \
  -d '{"value":{"type":"JSON","data":{"asset":"PUMP-01","temp":71.5}}}'

# run ksqlDB statements
curl -s -X POST localhost:8088/ksql -H 'Content-Type: application/vnd.ksql.v1+json' \
  -d '{"ksql":"SHOW STREAMS; SHOW TABLES; SHOW QUERIES;"}'
Kafka clients on the same machine connect to localhost:29092.
Create a second table that joins the two streams: page views per user region. Make a
stream over users, re-key it into a table by userid, join PAGEVIEWS_S to it and
GROUP BY REGIONID. Then open the Flow tab and see the lineage grow.
9 · Behind the scenesDesign notes and one trap
- Why 7.9 and not 8.x. Confluent Platform 8 replaced Control Center with a new version that needs Prometheus and Alertmanager next to it. 7.9 is the last line with the single-container Control Center, which keeps a sandbox to six containers.
- Replication factor 1 everywhere. With one broker every internal topic (offsets, transactions, Connect state,
Control Center, ksqlDB) has to be set to one replica. A production cluster runs at least three brokers with
replication factor 3 and
min.insync.replicas=2. - Start order. Everything except the broker waits for port 9092 before starting, so the pod also comes back cleanly after a host restart.
- Control Center behind a proxy. Control Center proxies most ksqlDB calls server-side under
/api/ksql/ksqldb1/…, so the ksqlDB streams, tables, flow and query pages, and CREATE statements run in the editor, work through a reverse proxy.
SELECT statements are the exception, push and pull alike. For those the browser opens a WebSocket straight to the
ksqlDB advertised URL (CONTROL_CENTER_KSQL_<NAME>_ADVERTISED_URL), not through Control
Center. If that URL is http://localhost:8088, queries work on the host and fail everywhere else with “An
unknown error has occurred”, while every other ksqlDB page keeps working, which makes it look like a ksqlDB problem.
The fix: advertise the public address (https://your-host) and route its /ws/ path to ksqlDB
in the reverse proxy, so the browser's wss://your-host/ws/query reaches port 8088.
10 · ReferenceGlossary
- Topic
- A named, append-only log of records, split into partitions.
- Partition
- The unit of order and parallelism. Records are ordered within a partition, not across partitions.
- Offset
- A record's fixed position in its partition.
- Consumer group
- A set of consumers sharing the work of reading a topic; each partition goes to one member.
- Lag
- Latest offset minus the group's committed offset.
- KRaft
- Kafka's built-in Raft metadata quorum, which replaced ZooKeeper.
- Subject
- The name schemas are versioned under in Schema Registry, usually
<topic>-value. - Source / sink connector
- Connect plugins that bring data into Kafka or deliver it out.
- Stream / table
- ksqlDB views of a topic: every event, or the latest value per key.
- Persistent query
- A ksqlDB statement that keeps running and writes its results to a topic.
- Push / pull query
- A query that streams changes until stopped, or one that returns the current state and ends.
Built and tested on Confluent Platform 7.9.10 (cp-server KRaft broker, Schema Registry, Kafka Connect with kafka-connect-datagen, ksqlDB, REST Proxy, Control Center), October 2026. Screens captured from the live environment.