IBM Maximo Application Suite · Red Hat OpenShift · Integration · IoT · Monitor
Maximo integration, from a sensor reading to a work order: MIF, JMS, Kafka and MQTT explained
New to Maximo integration, you meet four acronyms in the first week: MIF, JMS, Kafka and MQTT. They are not four competing products. They are four tools for two different jobs, and on Maximo Application Suite they meet in one place: Red Hat OpenShift. This guide explains each one in plain words, then makes you use it. Every exercise was run on a live system, and every screenshot shows what you should see on yours.
- The difference between a queue, a Kafka topic and an MQTT topic, and when each is the right tool.
- How Kafka runs on OpenShift, how to create a topic, send and read messages, and where a message sits on disk.
- What the IoT tool of the suite is made of, and how a sensor reading travels from MQTT through Kafka into Monitor.
- The kinds of gateway between a plant and the suite, and which one fits which situation.
- What Monitor does with the data, and why a business pays for it.
- The Maximo Integration Framework (MIF): object structures, channels, services, external systems, end points and queues, how to switch on JMS in a containerised Manage, and where queue messages are processed and stored.
Reading time: about 30 minutes. Doing the exercises: half a day.
Part 1The map: two kinds of integration
Before any product name, separate two jobs. Almost every integration question in a Maximo project is one of them.
A purchase order from the ERP, an asset from the engineering system, a work order to the contractor's portal. A few thousand messages a day. Each one matters, each must arrive exactly once and in order, and a human will ask where it went.
A temperature every ten seconds from every pump. Millions of small readings a day. No single reading matters much. What matters is the trend, and what the trend says about the asset.
Job 1 is the territory of the Maximo Integration Framework inside Manage, with JMS queues (or Kafka) behind it. Job 2 is the territory of MQTT, the IoT tool and Monitor, with Kafka in the middle. The two meet when Monitor decides that a trend deserves attention and creates a service request or a work order in Manage.
Part 2Four words that get mixed up
| Word | What it is | A picture to hold in your head | Where you meet it in the suite |
|---|---|---|---|
| JMS queue | A line of messages inside a messaging server. A message is delivered to one consumer and is then removed. | A post office box. Once you take the letter, the box is empty. | The classic MIF queues
of Manage: sqout, sqin, cqin. |
| Kafka topic | A log of messages on disk, split into partitions. Readers keep their own bookmark (the offset). Messages stay until the retention time is over. | A ship's log book. Many people can read it, each with their own bookmark, and nobody tears pages out. | Device events between the IoT tool and Monitor. Optionally, MIF queues. |
| MQTT topic | An address string that a small device publishes to on a broker. Built for thousands of weak connections. The broker passes the message on and does not keep history. | A radio channel. If nobody is listening at that moment, the words are gone. | Devices and gateways sending readings to the IoT tool. |
| MIF | Not a transport at all. It is the part of Manage that turns a business object into a message and a message into a business object, with rules, security and error handling. | The shipping department. It packs, labels and checks. The truck is somebody else. | The Integration module of Manage. |
MQTT gets data off a device, Kafka moves and keeps streams of data between applications, JMS hands over business messages one by one, and MIF is the Maximo logic that gives a message its meaning.
Part 3Kafka on OpenShift
On OpenShift nobody installs Kafka by hand. An operator does it. You write a short description of the cluster you
want (a custom resource of kind Kafka), and the operator creates the pods, the storage, the certificates and
the network routes, and keeps them that way.
The open-source operator for Kafka is called Strimzi. Red Hat's supported product, Streams for Apache Kafka
(until recently named AMQ Streams), is built from Strimzi, and the resources look the same: Kafka,
KafkaTopic, KafkaUser. The system used for this guide runs the Strimzi operator 0.45 with
Kafka 3.9, installed by the suite's own installer. Everything below applies to both.
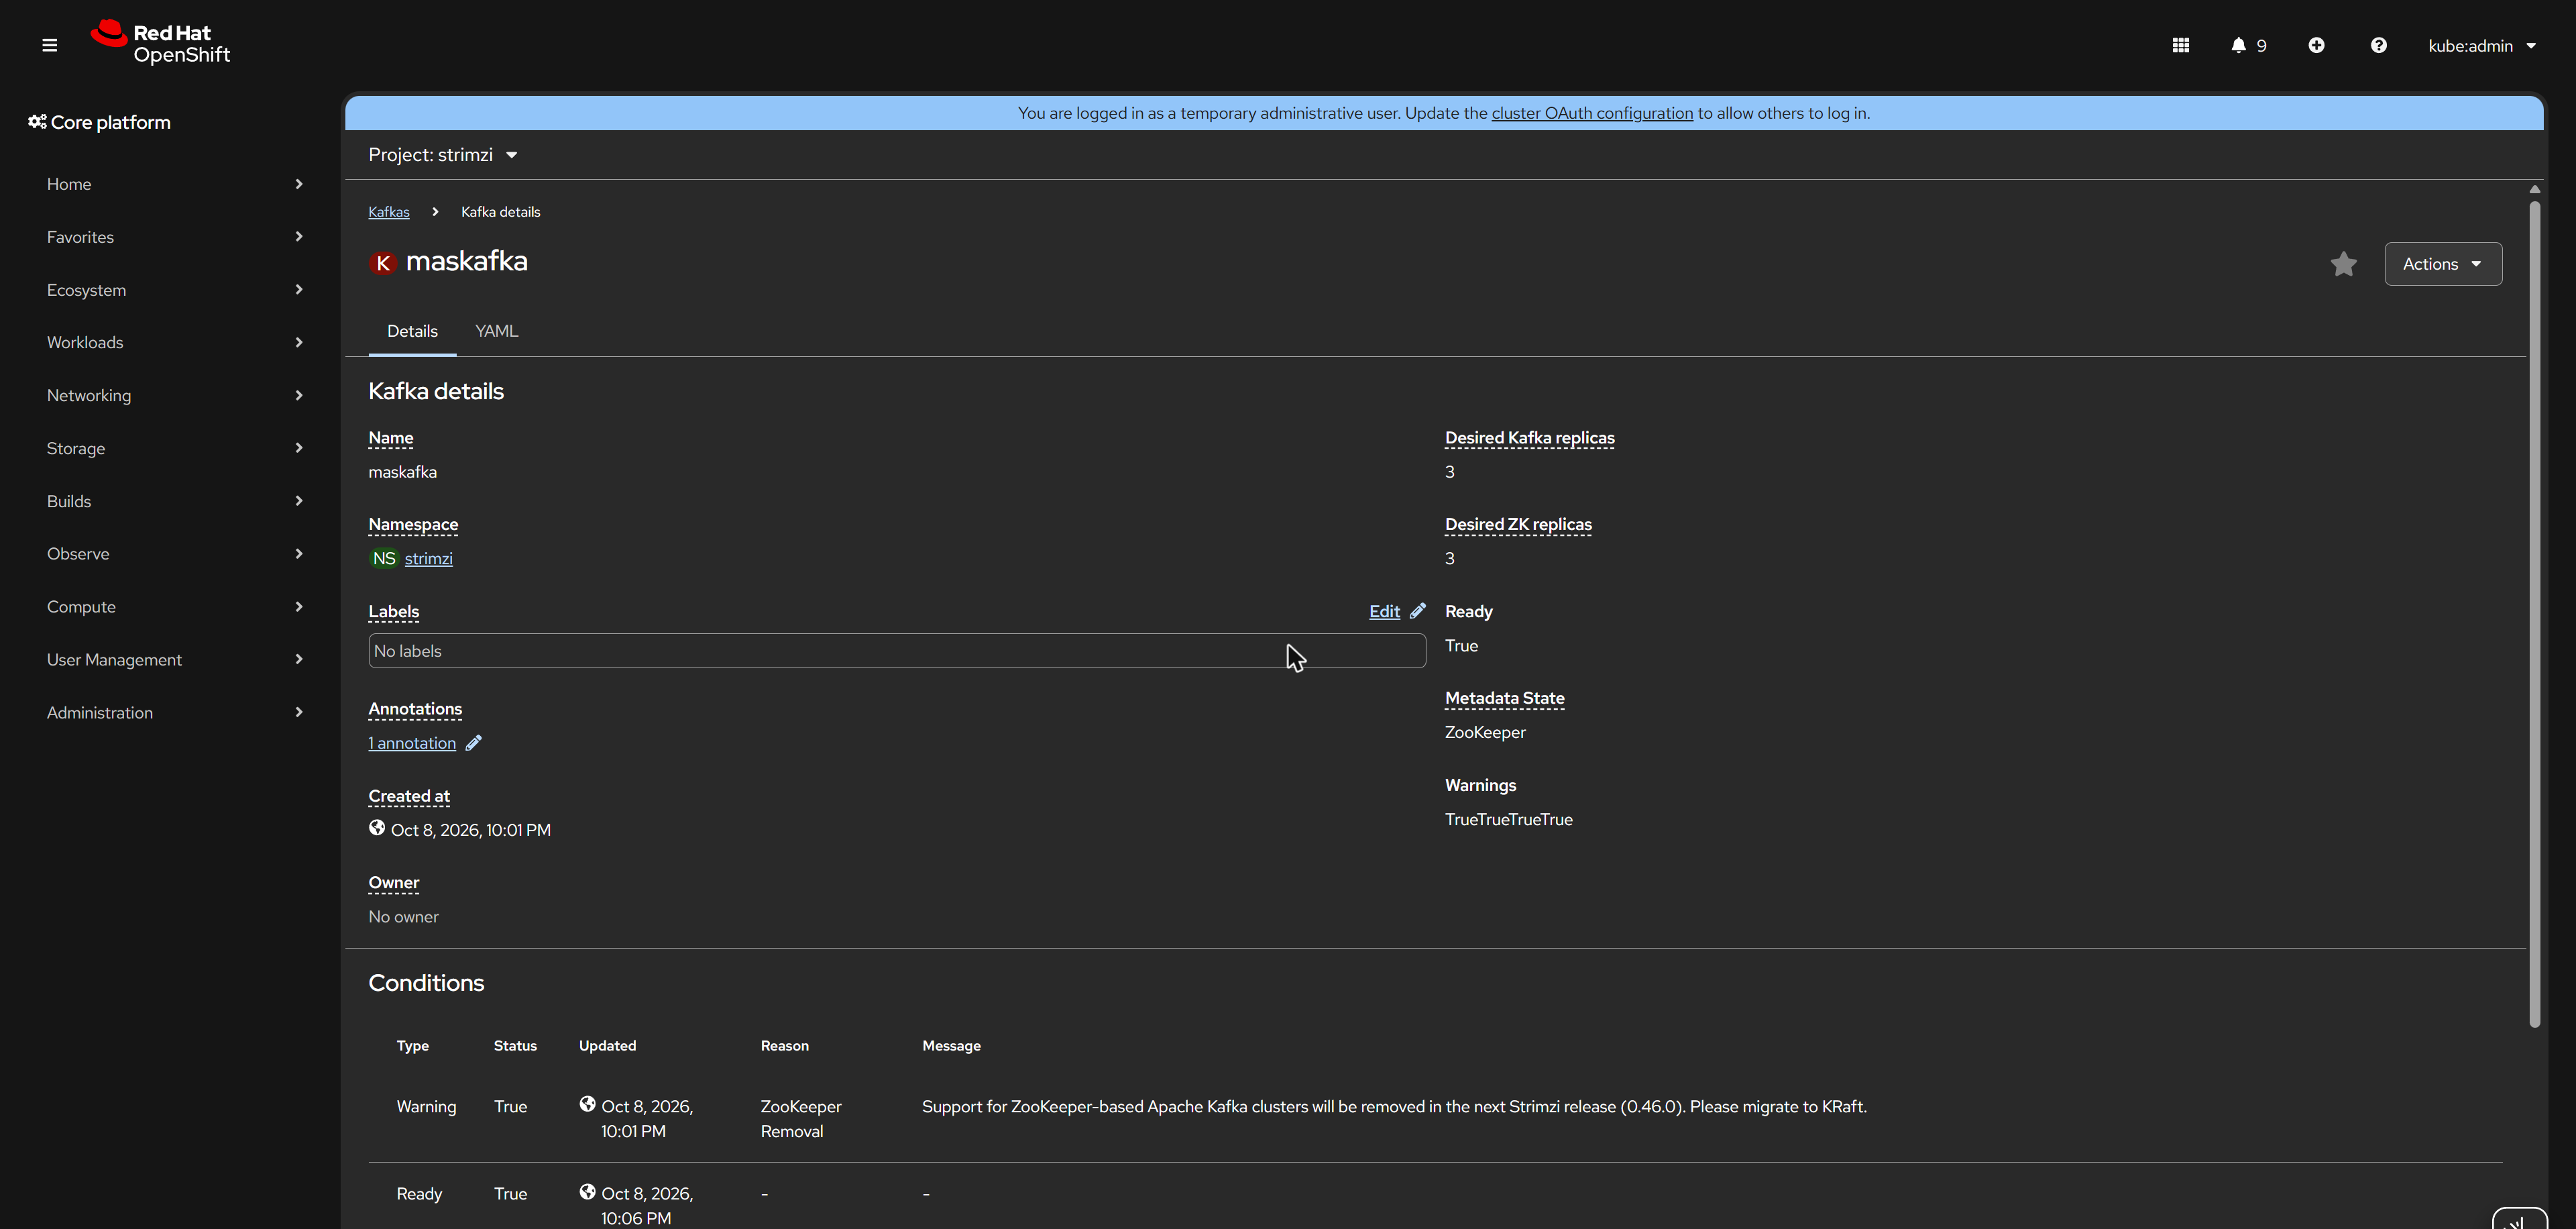
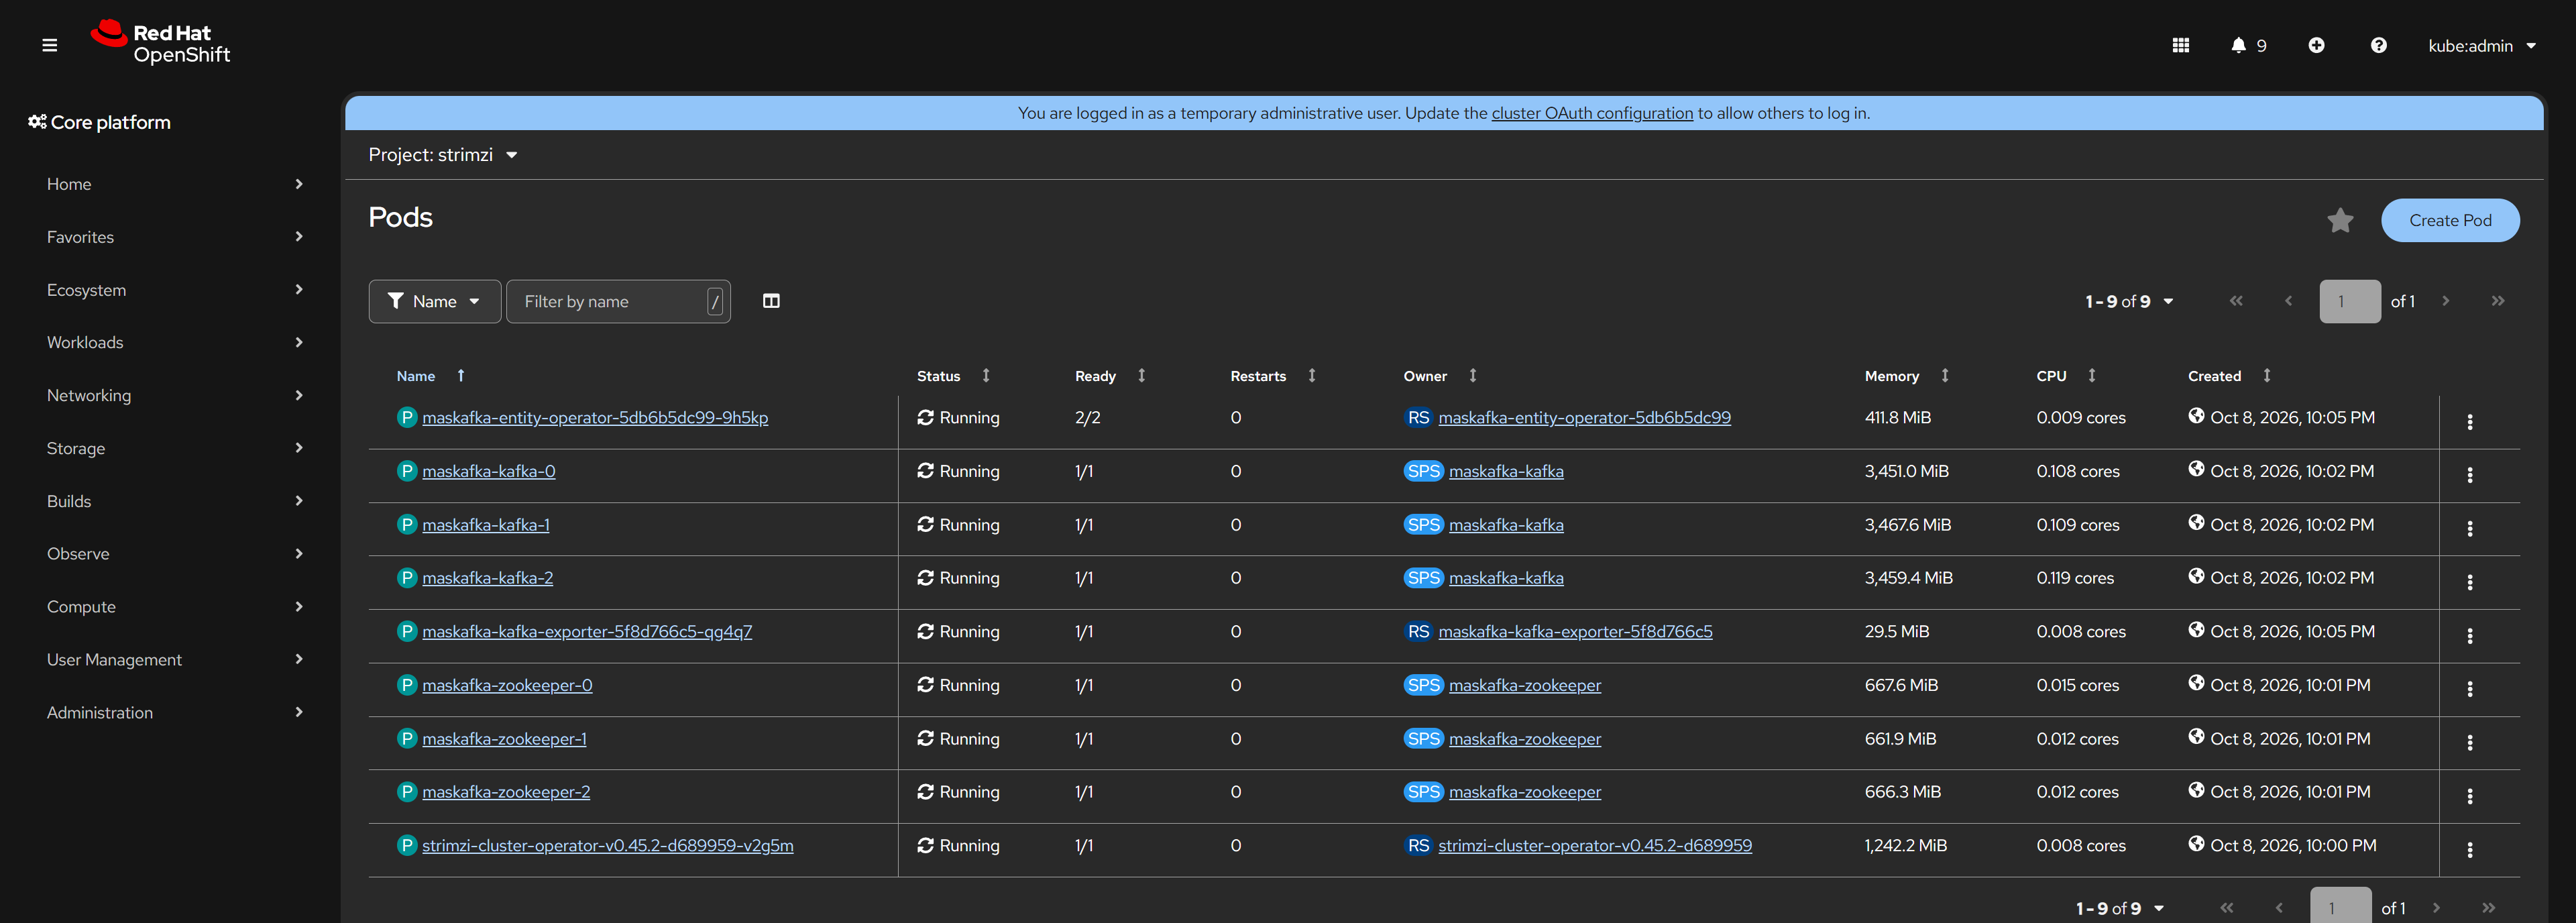
maskafka, three brokers, three ZooKeeper nodes, Ready. The warning says what it means: newer Kafka versions replace ZooKeeper with KRaft.That single resource becomes nine pods: three brokers, three ZooKeeper nodes, the operator itself, an entity operator (it watches topic and user resources) and an exporter for metrics.
The five Kafka words
| Word | Meaning | On this system |
|---|---|---|
| Broker | One Kafka server. A cluster has several. | maskafka-kafka-0, -1, -2, each with a 100 GiB volume. |
| Topic | A named stream of messages. | 16 topics created by the suite, all named instdb2_… after the suite instance. |
| Partition | A topic is cut into partitions so several brokers and several readers can share the work. Order is kept inside a partition only. | instdb2_topic_events has 3 partitions. |
| Offset | The position of a message in its partition: 0, 1, 2 … | You will see it in every exercise. |
| Consumer group | A named team of readers that shares one bookmark per partition. | group-INPUT_PROCESSOR-instdb2 is Monitor reading device events. |
Three settings of this cluster are worth knowing, because they explain behaviour you will see later:
- Messages are kept for 24 hours (or until a partition reaches 1 GiB). Kafka here is a pipe with a memory of one day, not an archive.
- Topics are not created automatically. A program that writes to a topic that does not exist gets an error. Somebody must create the topic first.
- Clients must log in with a user and password (SCRAM-SHA-512) over TLS. Inside the cluster the address is
maskafka-kafka-bootstrap.strimzi.svc:9093; from outside it is an OpenShift route on port 443.
Exercise 1: create a topic, send five messages, read them twice
You need: a login to the OpenShift cluster with the oc command, Python 3 on your laptop, and the Kafka
user name, password and CA certificate. On a suite cluster they are in the secret that the suite's Kafka configuration
points to, and in the status of the Kafka resource.
Step 1. Create the topic the OpenShift way. A topic is a resource too. Save this as topic.yaml:
YAMLapiVersion: kafka.strimzi.io/v1beta2
kind: KafkaTopic
metadata:
  name: demo.pump.alerts
  namespace: strimzi
  labels:
    strimzi.io/cluster: maskafka      # which Kafka cluster owns the topic
spec:
  partitions: 3
  replicas: 3
  config:
    retention.ms: 86400000            # keep messages for one day
Shell$ oc apply -f topic.yaml
kafkatopic.kafka.strimzi.io/demo.pump.alerts created

$ oc get kafkatopic -n strimzi
NAME               CLUSTER    PARTITIONS   REPLICATION FACTOR   READY
demo.pump.alerts   maskafka   3            3                    True
Step 2. Send five messages. Install a client with pip install kafka-python-ng. The connection settings
are the same for every program, so they go in one small file, kc.py:
PythonBOOT = "maskafka-kafka-tls-bootstrap-strimzi.apps.<your-cluster-domain>:443"

def cfg():
    return dict(bootstrap_servers=BOOT, security_protocol="SASL_SSL", sasl_mechanism="SCRAM-SHA-512",
                sasl_plain_username=open("user.txt").read().strip(),
                sasl_plain_password=open("password.txt").read().strip(),
                ssl_cafile="kafka-ca.crt")
The producer gives every message a key, the pump's name. Kafka uses the key to choose the partition:
Python# produce.py
import json
from kafka import KafkaProducer
from kc import cfg

p = KafkaProducer(**cfg(), key_serializer=str.encode,
                  value_serializer=lambda v: json.dumps(v).encode(), acks="all")
for i, pump in enumerate(["PUMP-001", "PUMP-002", "PUMP-001", "PUMP-003", "PUMP-001"]):
    md = p.send("demo.pump.alerts", key=pump,
                value={"pump": pump, "alert": "HIGH_VIBRATION", "seq": i}).get(15)
    print(f"sent key={pump} seq={i} -> partition {md.partition} offset {md.offset}")
p.flush()
Shell$ python produce.py
sent key=PUMP-001 seq=0 -> partition 1 offset 0
sent key=PUMP-002 seq=1 -> partition 2 offset 0
sent key=PUMP-001 seq=2 -> partition 1 offset 1
sent key=PUMP-003 seq=3 -> partition 0 offset 0
sent key=PUMP-001 seq=4 -> partition 1 offset 2
All three messages of PUMP-001 went to partition 1, at offsets 0, 1 and 2. Same key, same partition, so the order of one pump's messages is kept. Different pumps may land on different partitions, and across partitions there is no order. This is the most important design rule in Kafka: choose the key so that things that must stay in order share it.
Step 3. Read them, as a named group.
Python# consume.py
import sys
from kafka import KafkaConsumer
from kc import cfg

group = sys.argv[1]
c = KafkaConsumer("demo.pump.alerts", **cfg(), group_id=group,
                  auto_offset_reset="earliest", consumer_timeout_ms=12000)
n = 0
for m in c:
    n += 1
    print(f"[{group}] partition {m.partition} offset {m.offset} key={m.key.decode()} value={m.value.decode()}")
print(f"[{group}] read {n} messages")
c.close()
Shell$ python consume.py demo-readers
[demo-readers] partition 1 offset 0 key=PUMP-001 value={"pump": "PUMP-001", "alert": "HIGH_VIBRATION", "seq": 0}
[demo-readers] partition 1 offset 1 key=PUMP-001 value={"pump": "PUMP-001", "alert": "HIGH_VIBRATION", "seq": 2}
[demo-readers] partition 1 offset 2 key=PUMP-001 value={"pump": "PUMP-001", "alert": "HIGH_VIBRATION", "seq": 4}
[demo-readers] partition 2 offset 0 key=PUMP-002 value={"pump": "PUMP-002", "alert": "HIGH_VIBRATION", "seq": 1}
[demo-readers] partition 0 offset 0 key=PUMP-003 value={"pump": "PUMP-003", "alert": "HIGH_VIBRATION", "seq": 3}
[demo-readers] read 5 messages

$ python consume.py demo-readers        # the same group again
[demo-readers] read 0 messages

$ python consume.py audit-team          # a different group
...
[audit-team] read 5 messages
The second run of demo-readers read nothing: the group's bookmark already stands after the last message.
But the messages were not removed. A new group, audit-team, read all five again. With a JMS queue the first
reader would have emptied it. With Kafka, a second system can be connected a week later without changing the sender,
as long as the messages are still inside the retention time.
Where is a Kafka message stored?
On the disk of the brokers, as plain files. Each broker has a persistent volume. Each partition is a directory named
<topic>-<partition>, and inside it the messages are appended to a segment file ending in
.log. You can look at it from the OpenShift console: open a broker pod, choose the Terminal tab, and
list the directory. The tool kafka-dump-log.sh, which ships with Kafka, prints what a segment file contains.
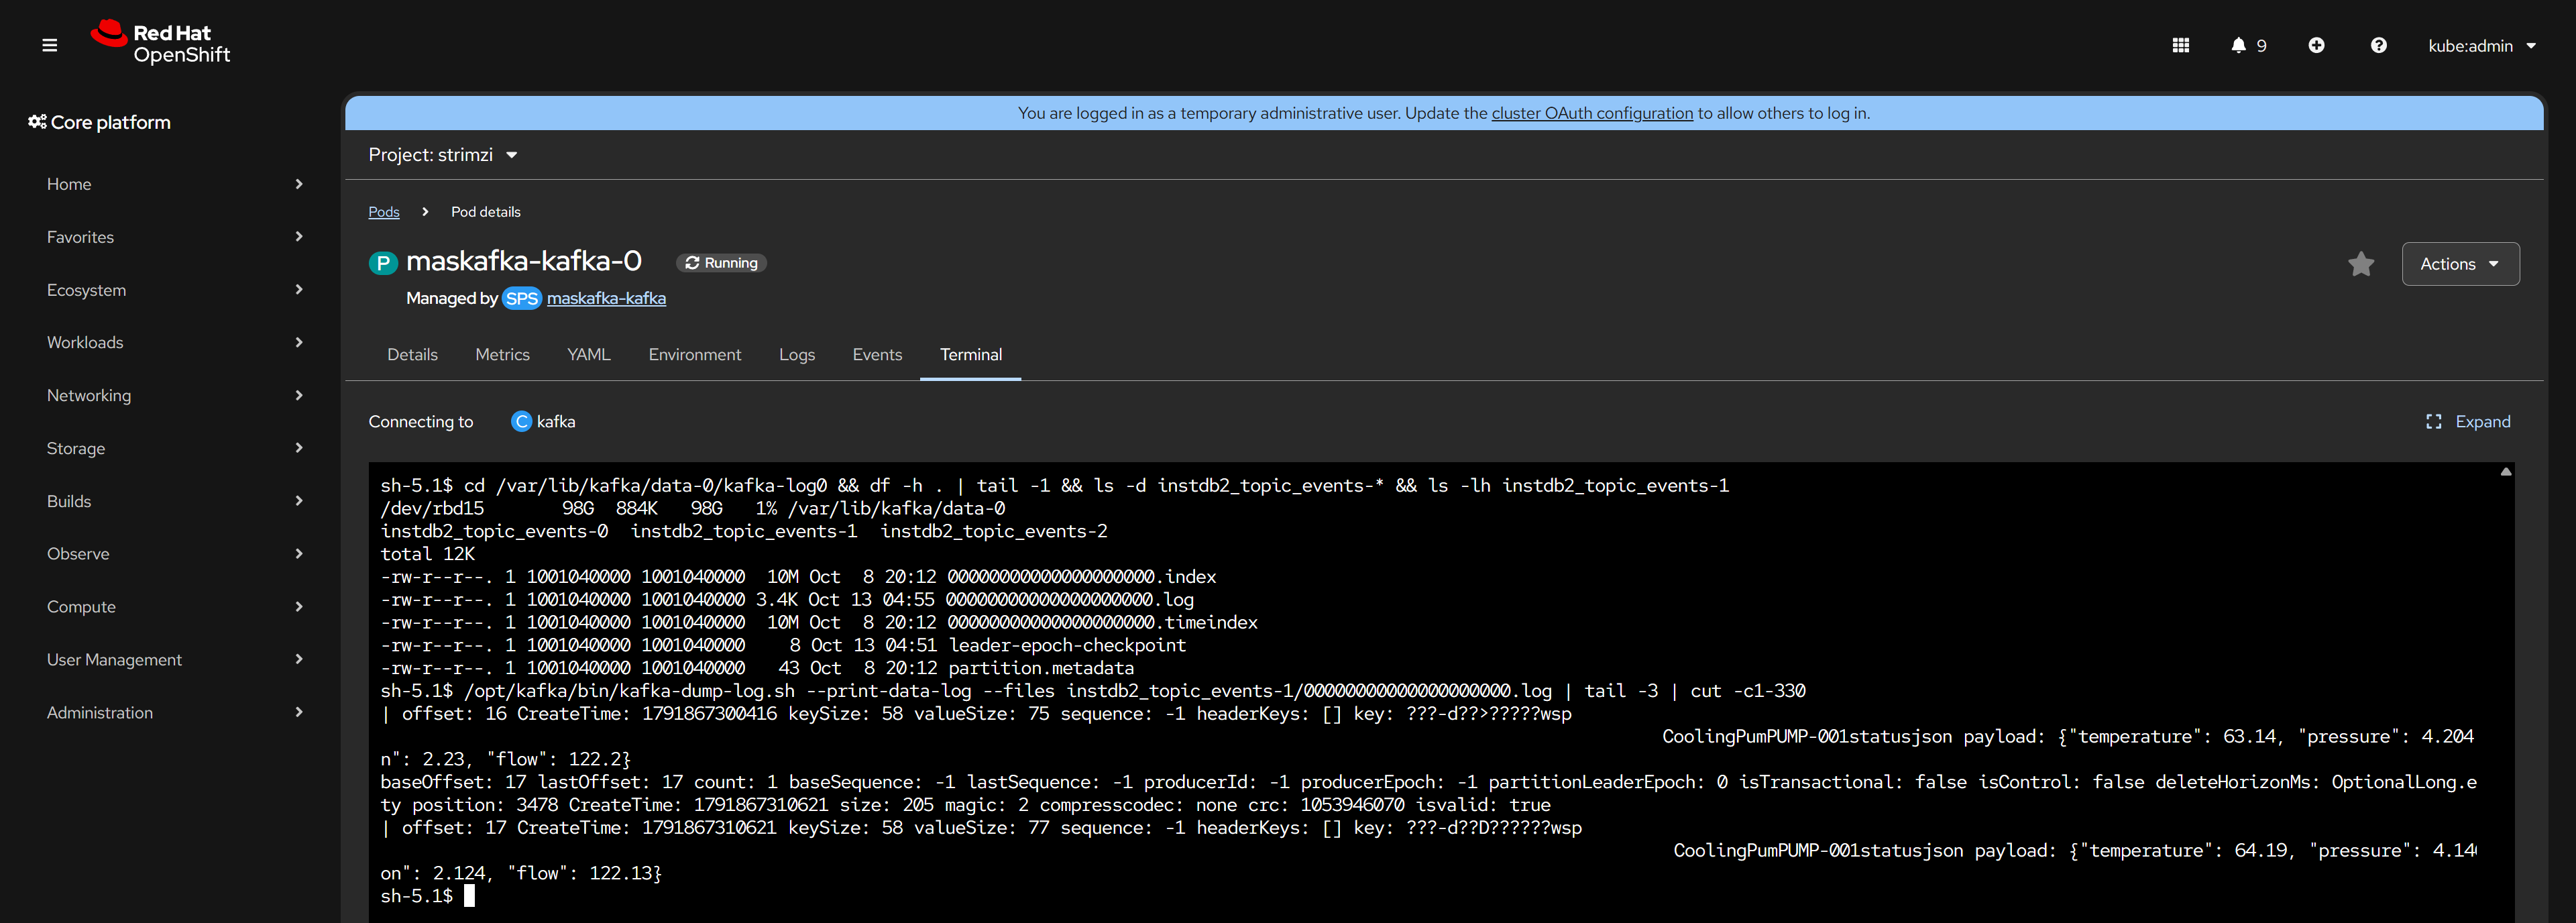
instdb2_topic_events has three partition directories; partition 1 holds a 3.4 KB .log file, and the dump shows the records in it: the pump readings of exercise 2, with their offsets.So "where are the messages processed and stored?" has a precise answer for Kafka: stored in segment files on the brokers' volumes for the retention time, copied to three brokers; processed by whichever consumer groups read the topic, each at its own pace.
Part 4MQTT and the IoT tool, without the mystery
MQTT is the protocol small devices use to send data. It was designed for weak hardware and poor networks, which is why it is everywhere in industry. Its whole vocabulary is five words:
| Word | Meaning |
|---|---|
| Broker | The server every device connects to. Devices never talk to each other, only to the broker. |
| Client ID | The name a device connects with. One connection per client ID. |
| Topic | The address a message is published to, written like a path: iot-2/evt/status/fmt/json. |
| Publish / subscribe | A device publishes to a topic. Anyone subscribed to that topic receives the message. |
| QoS | How hard the broker and device try: 0 is "send and forget", 1 is "repeat until acknowledged", 2 is "exactly once". |
What the IoT tool really is
In the suite catalogue it is one tile called IoT. On OpenShift it is a handful of pods, and once you know their names the mystery is gone:
| Pod | What it is | Its job |
|---|---|---|
mbgx-amlen-0-0, -0-1 | Eclipse Amlen, an open-source MQTT broker (the former IBM MessageSight), as a pair with 100 GiB of storage each | Holds the MQTT connections of devices and gateways. |
mfgx-msproxy-… (two) | The MQTT proxy | The front door. Checks who a device is and whether its token is right, then passes its events on and writes them to Kafka. |
mbgx-api-mbgadmin, the operators | Administration | Configure the broker and keep the pieces healthy. |
auth-… | Authentication and authorization services | Answer "is this device registered, is this token valid?" |
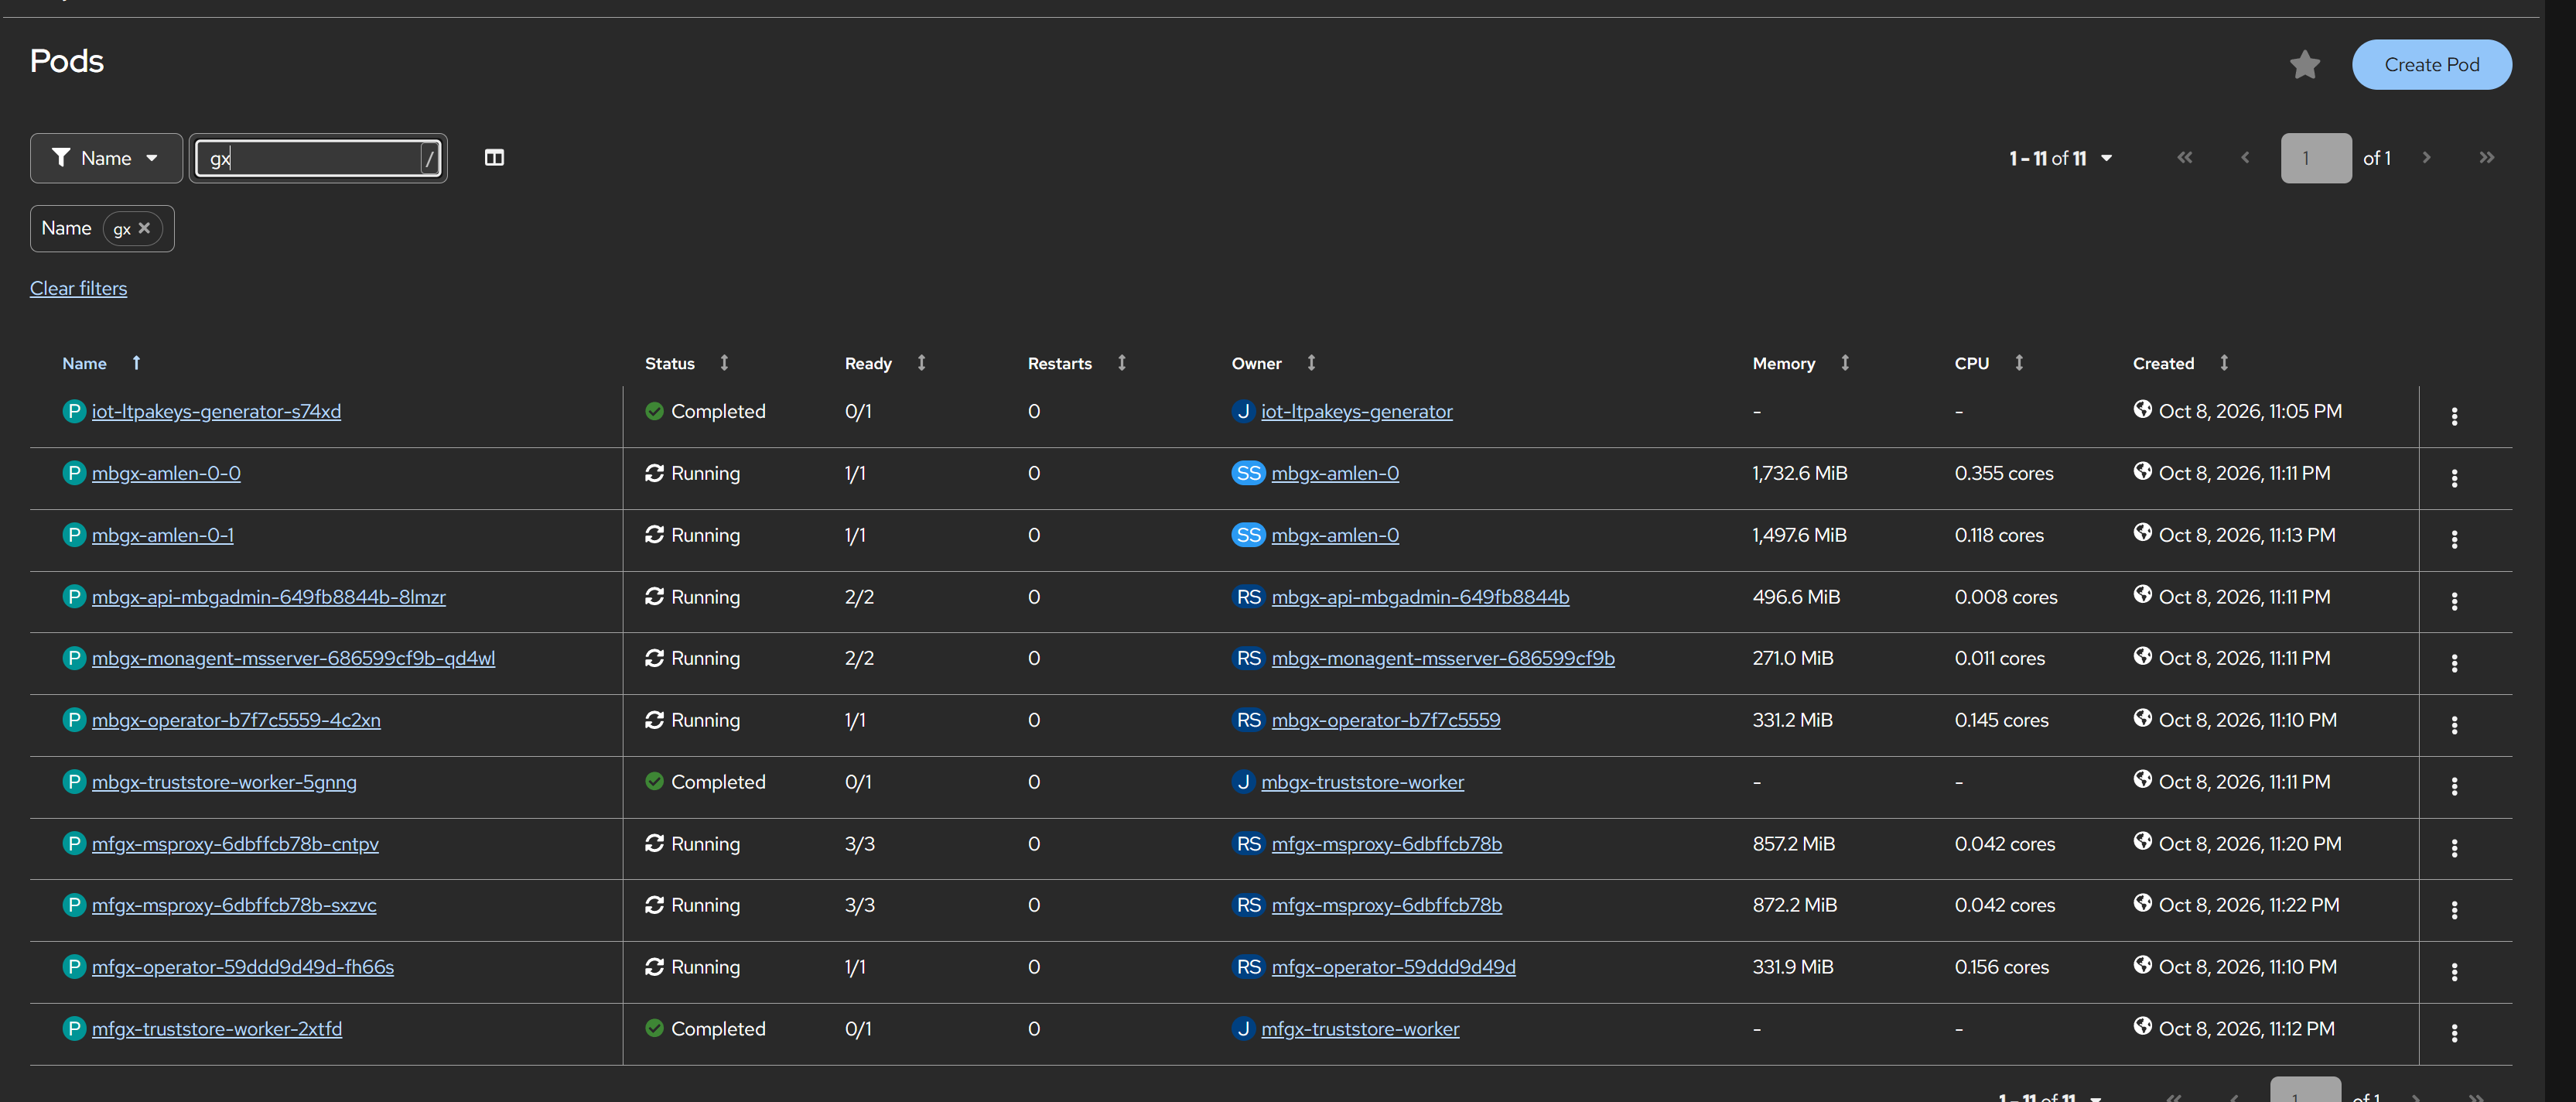
mbgx) and the two MQTT proxies (mfgx).And here is the part that links this chapter to the previous one. The IoT tool does not store your readings. It receives them over MQTT and writes them to a Kafka topic. Monitor is a Kafka consumer that reads that topic and puts the readings in its database.
Because they are good at different things. MQTT is good at the edge: tiny clients, unreliable links, one message at a time. It keeps no history. Kafka is good in the data centre: it keeps a day of data on disk, so Monitor can stop for an upgrade and catch up afterwards without losing readings, and a second consumer can be added without touching a device.
Exercise 2: register a pump, publish over MQTT, find the reading in Kafka
Since version 9 of the suite, devices are registered in Monitor, under Setup. There are two concepts:
- A device type is the template: "a cooling pump reports these four numbers".
- A device is one real thing of that type, with its own identity and secret token.
Step 1. Create the device type. In Monitor open Setup > Device types > Add device type. Choose Empty template. The sample types on the same page are worth a look later: they come with simulated data.
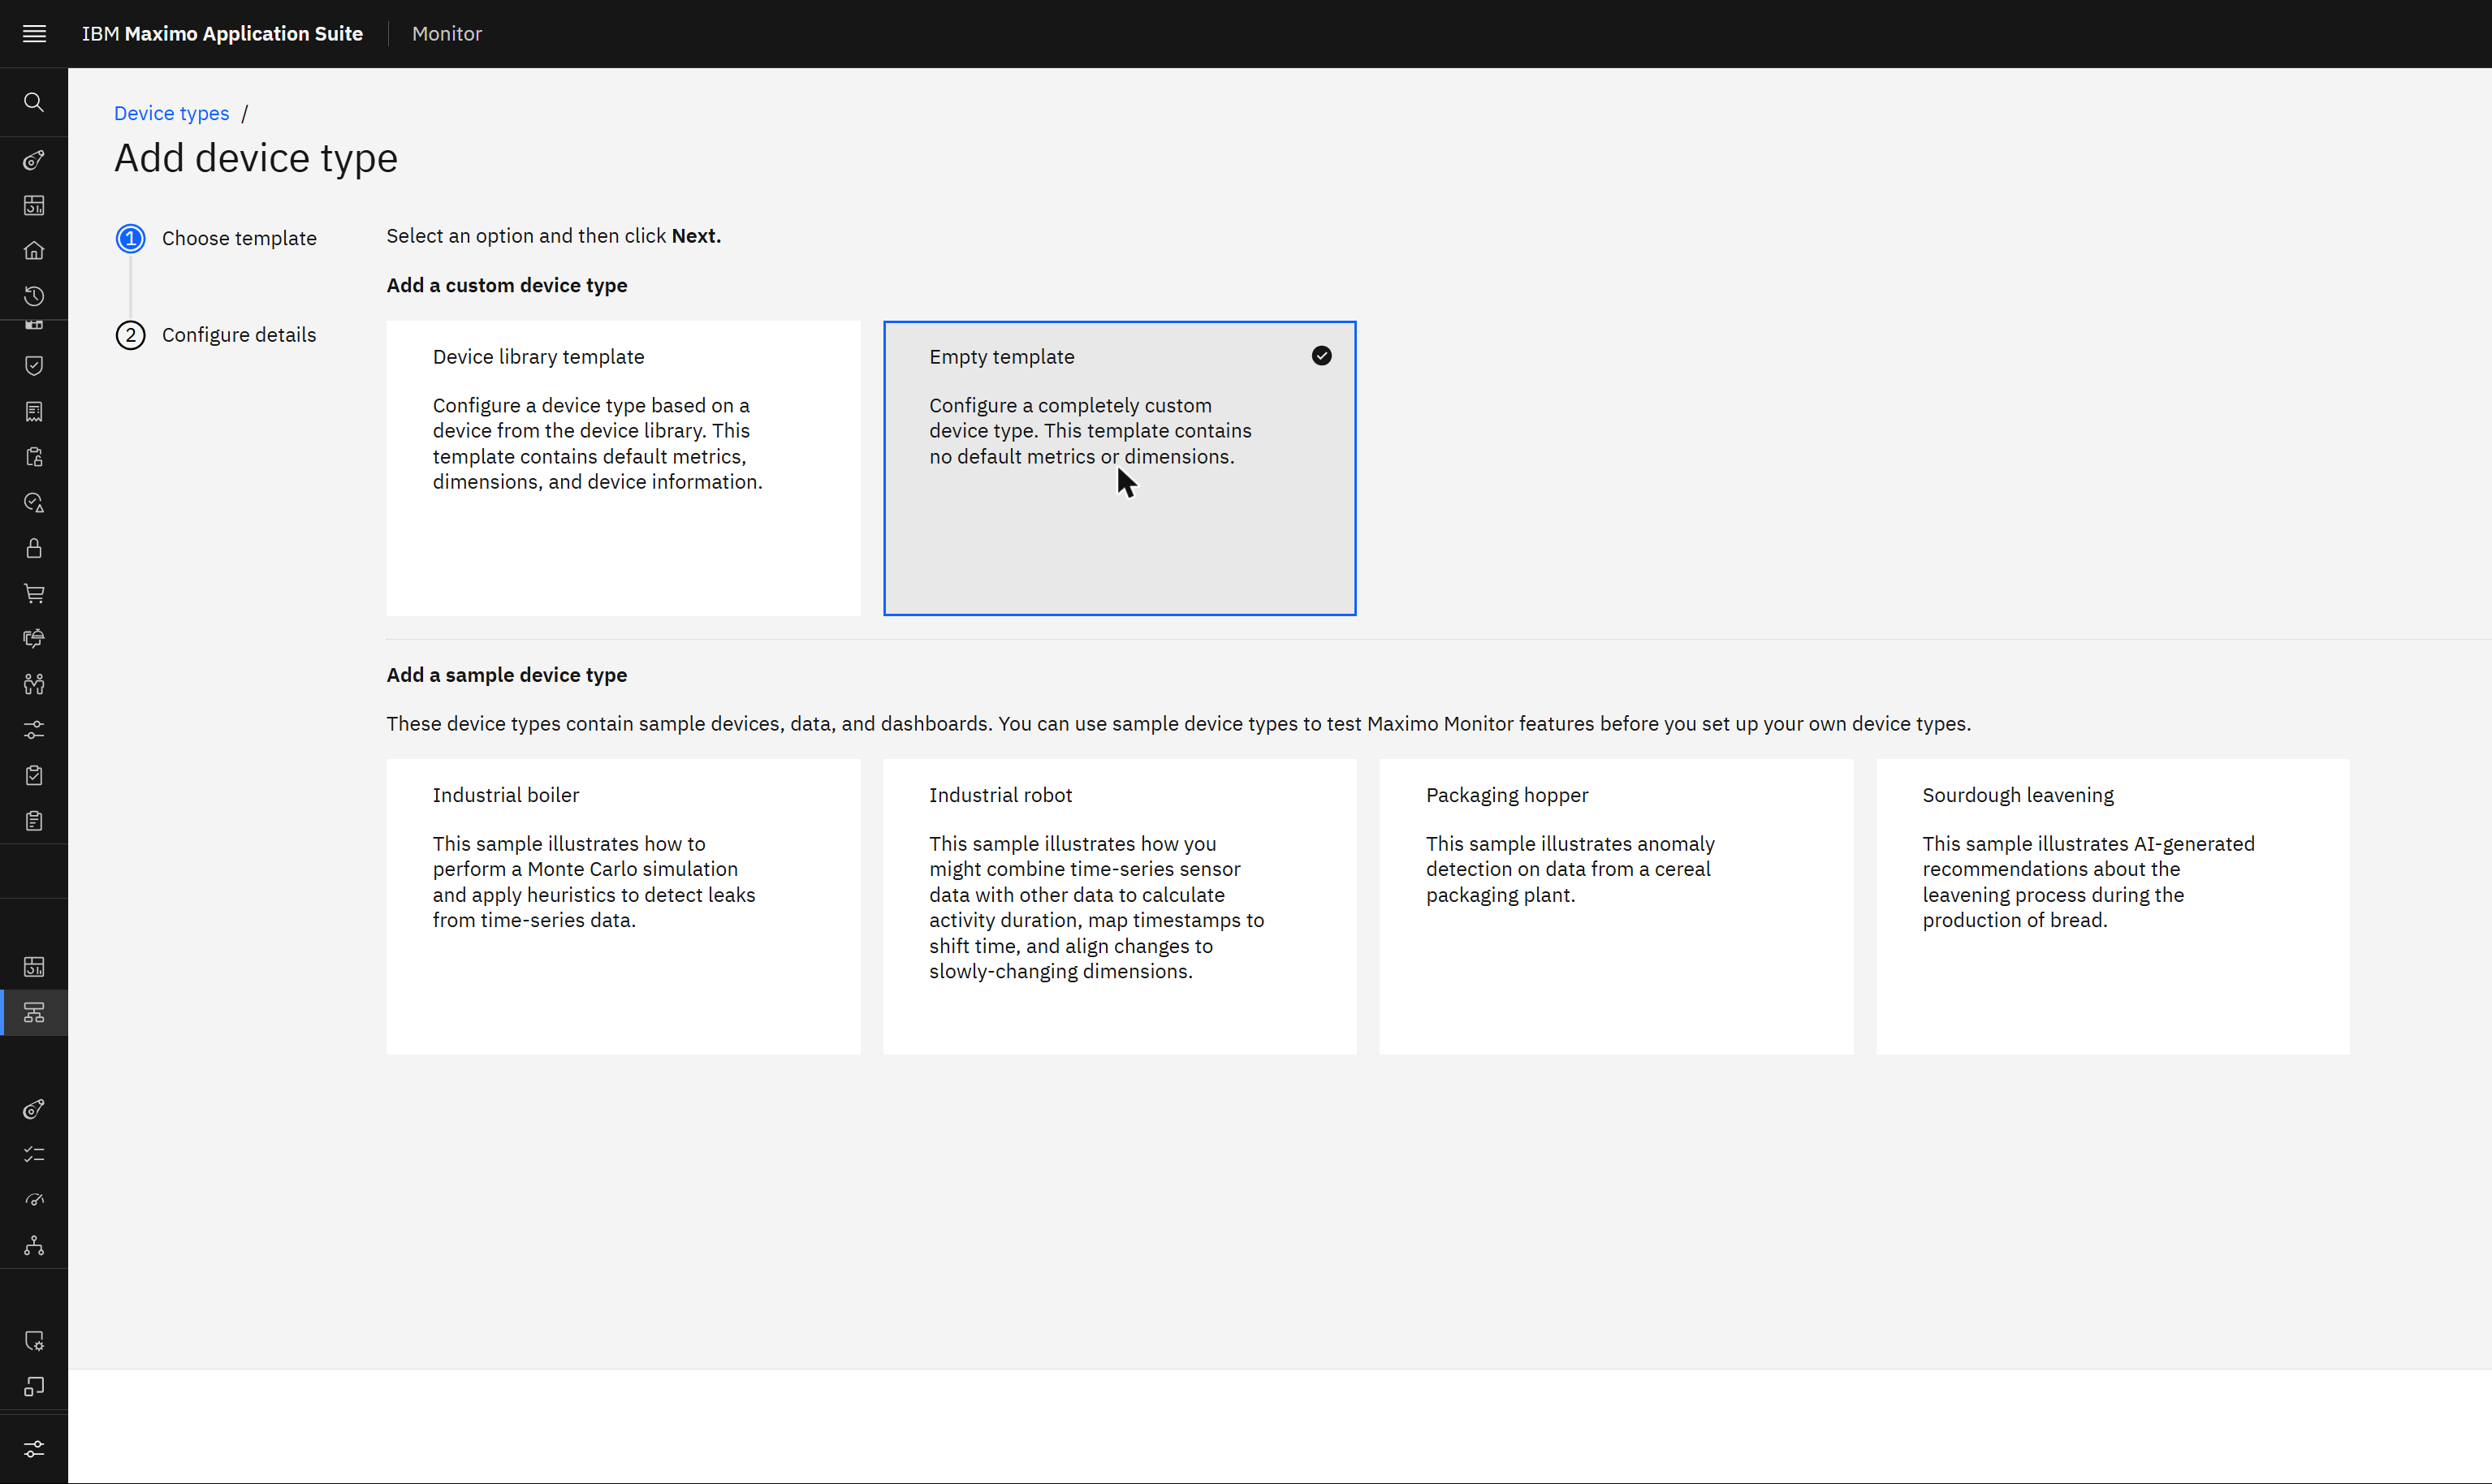
Name it CoolingPump. The name cannot be changed later, so decide your naming rule before the first one.
Step 2. Add the metrics. On the Metrics tab choose Add metric, once per number the pump reports.
Every metric belongs to an event, which is simply the name of the message the device sends. Here one event called
status carries all four numbers.
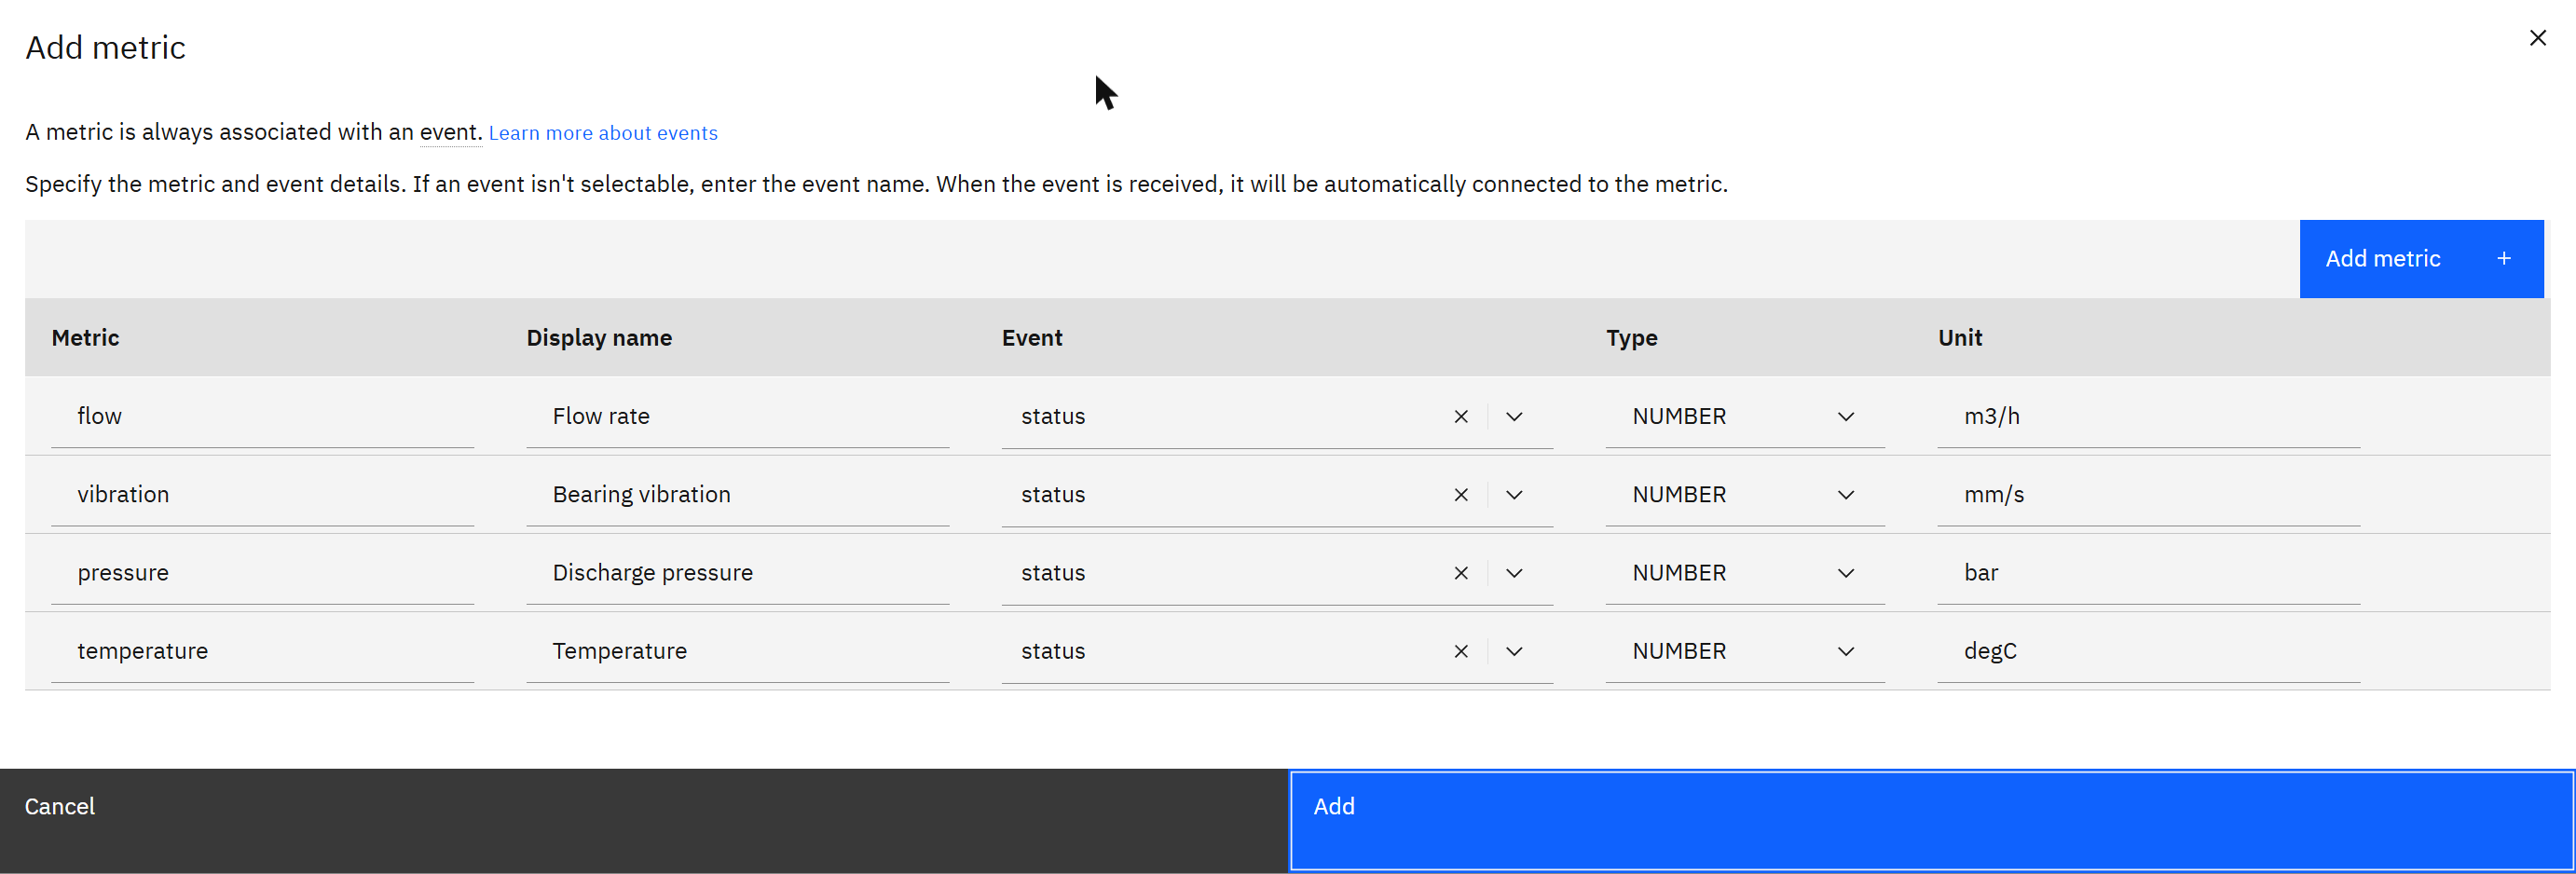
status. The metric name must match the field name in the JSON the device sends.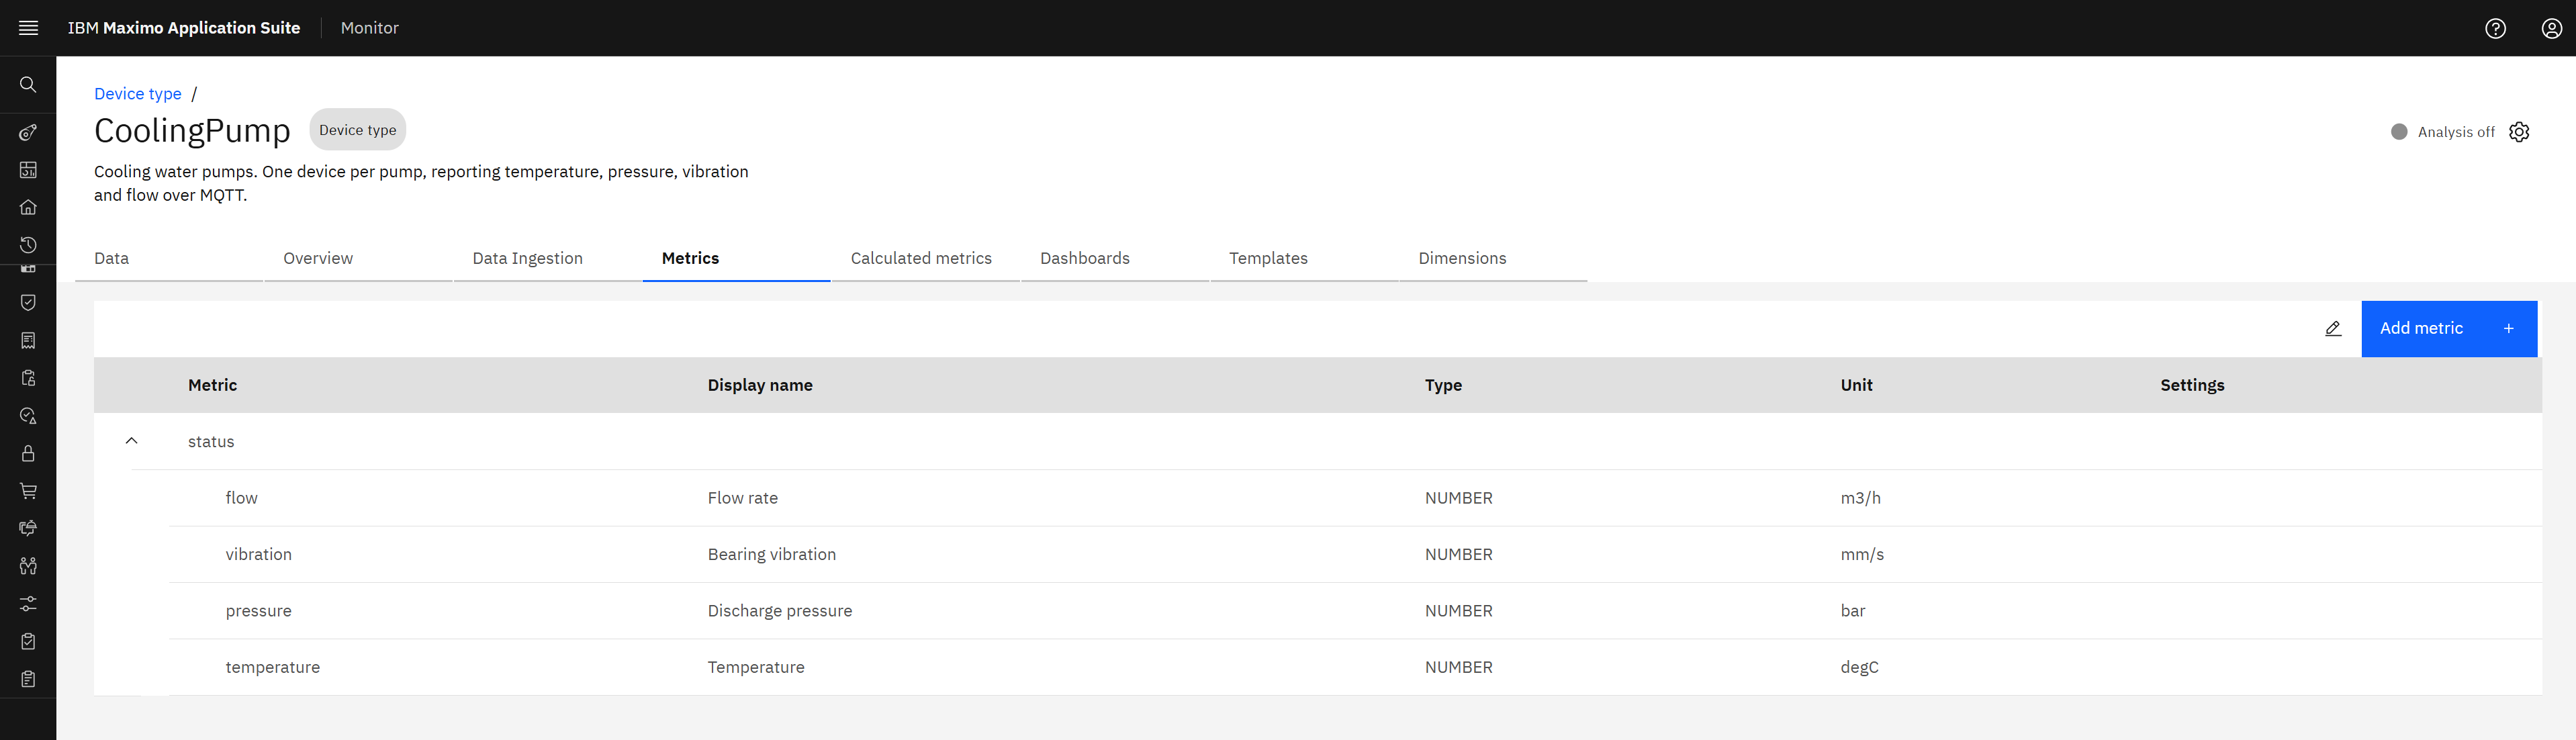
Step 3. Register a device. Open Setup > Devices > Add device. The first dialog is where gateways come in (Part 5); for a device that connects on its own, choose Add custom device and leave the gateway empty.
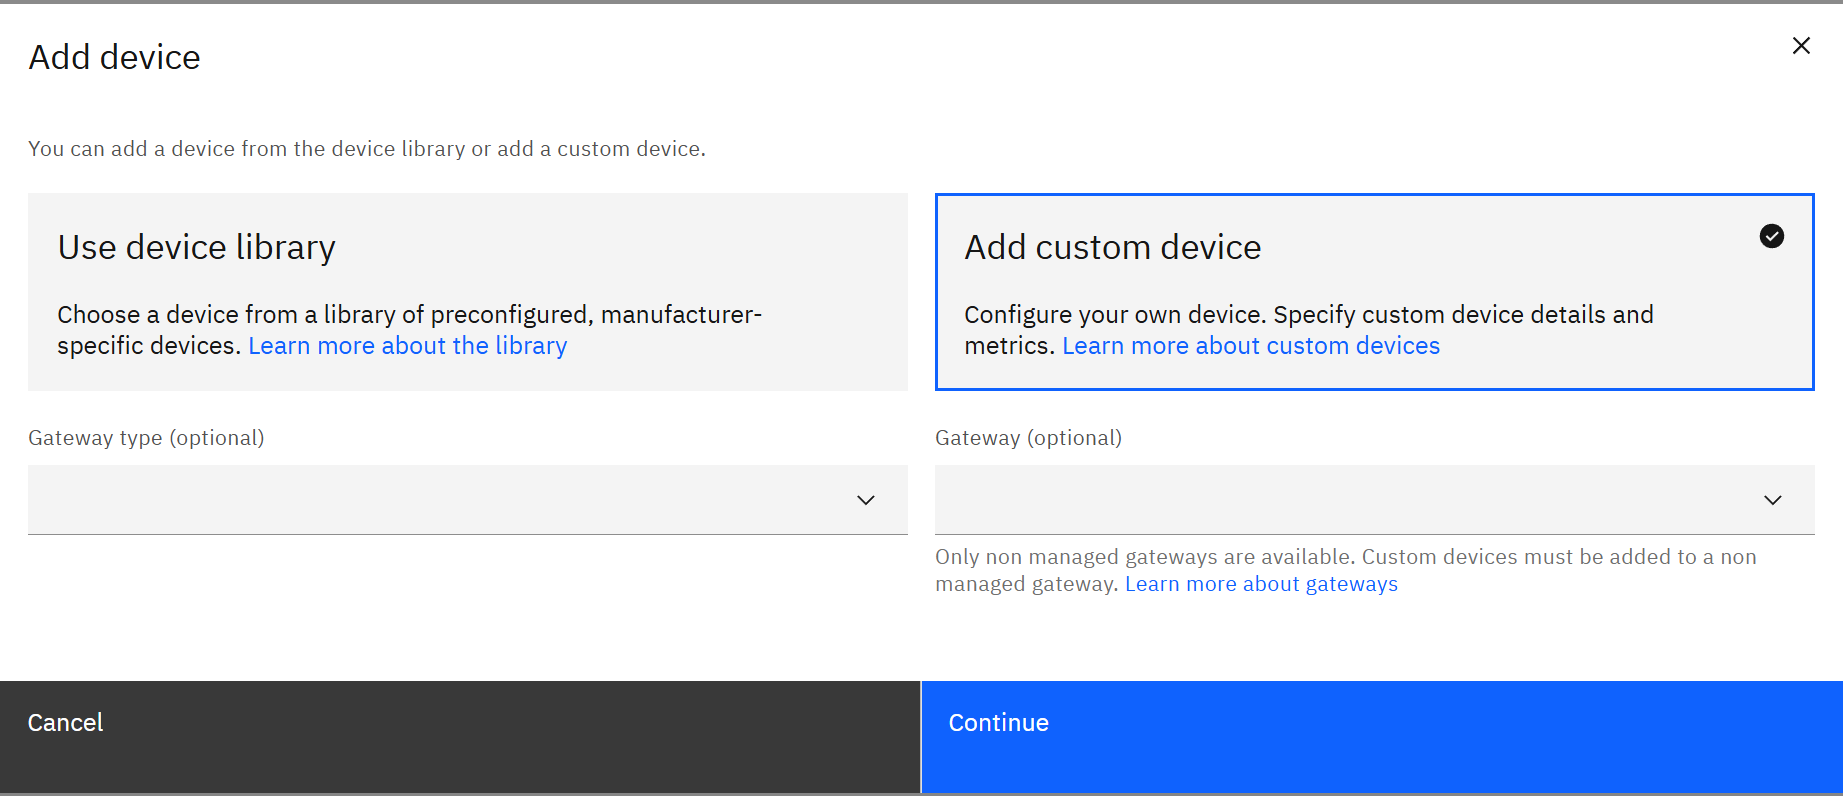
Give it the ID PUMP-001, leave the token on Auto-generated, and pick the type
CoolingPump. When you save, Monitor shows the credentials once.
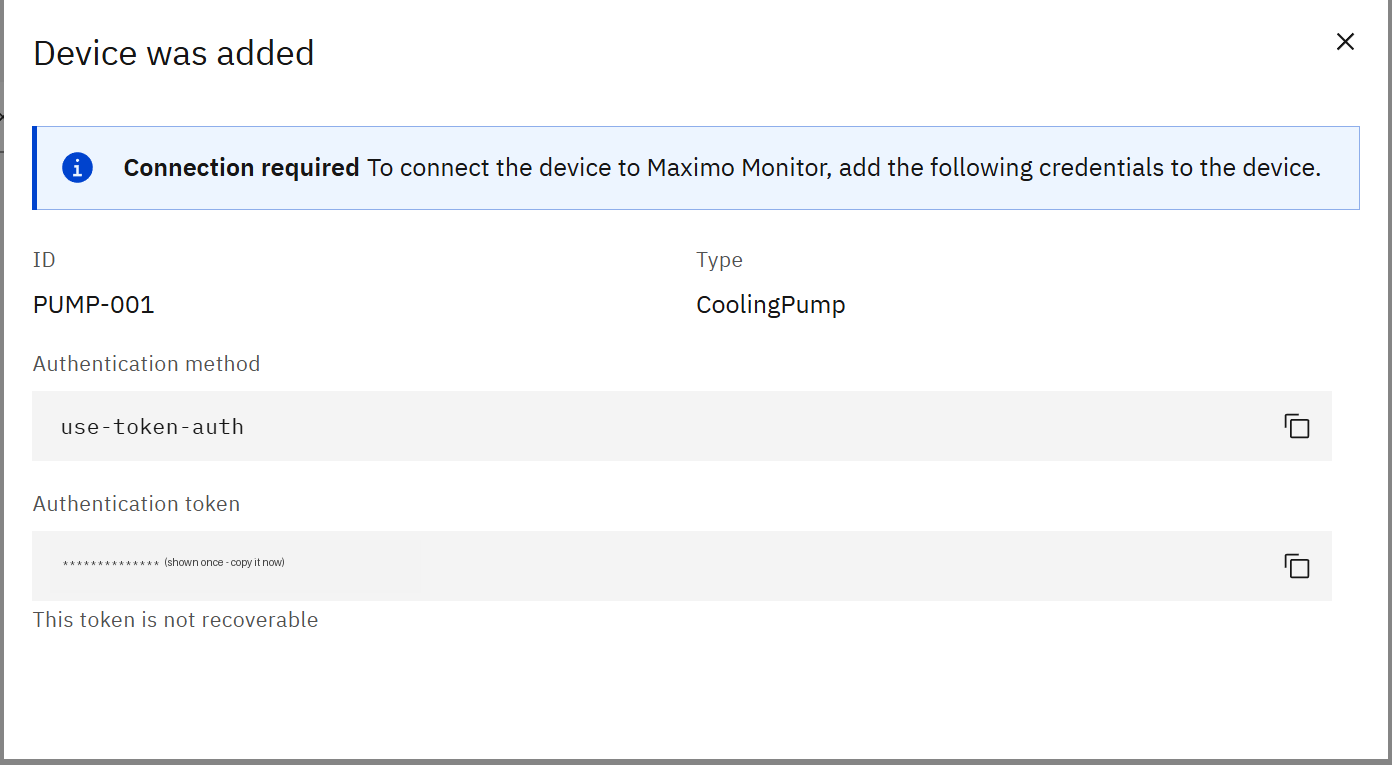
Step 4. Publish. A device proves who it is with three values. They follow a fixed pattern:
| MQTT setting | Pattern | In this exercise |
|---|---|---|
| Host and port | <workspace>.messaging.iot.<suite domain>, port 443 through the OpenShift route (8883 is the usual MQTT TLS port elsewhere) | wsp.messaging.iot.instdb2.apps…:443 |
| Client ID | d:<workspace>:<device type>:<device ID> | d:wsp:CoolingPump:PUMP-001 |
| User name | always use-token-auth | use-token-auth |
| Password | the device token | the token from step 3 |
| Topic | iot-2/evt/<event>/fmt/json | iot-2/evt/status/fmt/json |
With pip install paho-mqtt, a pump is twenty lines of Python:
Python# pump.py
import json, random, ssl, time
import paho.mqtt.client as mqtt

HOST = "wsp.messaging.iot.<your-suite-domain>"
c = mqtt.Client(mqtt.CallbackAPIVersion.VERSION2, client_id="d:wsp:CoolingPump:PUMP-001")
c.username_pw_set("use-token-auth", open("PUMP-001.token").read().strip())
ctx = ssl.create_default_context()
ctx.check_hostname = False; ctx.verify_mode = ssl.CERT_NONE   # lab only: load the suite CA instead
c.tls_set_context(ctx)
c.on_connect = lambda cl, u, flags, rc, props=None: print("connected:", rc)
c.connect(HOST, 443, keepalive=60)
c.loop_start(); time.sleep(2)

while True:
    reading = {"temperature": round(62 + random.uniform(-1, 1), 2),
               "pressure":    round(4.1 + random.uniform(-.1, .1), 3),
               "vibration":   round(2.1 + random.uniform(-.25, .25), 3),
               "flow":        round(120 + random.uniform(-2, 2), 2)}
    c.publish("iot-2/evt/status/fmt/json", json.dumps(reading), qos=1).wait_for_publish(10)
    print(time.strftime("%H:%M:%S"), reading)
    time.sleep(10)
Shell$ python pump.py
connected: Success
07:51:37 {'temperature': 62.47, 'pressure': 4.022, 'vibration': 2.299, 'flow': 121.07}
07:51:40 {'temperature': 62.37, 'pressure': 4.051, 'vibration': 1.995, 'flow': 121.13}
07:51:42 {'temperature': 62.87, 'pressure': 4.072, 'vibration': 2.069, 'flow': 121.49}
Step 5. See it arrive. In Monitor open the device and its Recent event tab.
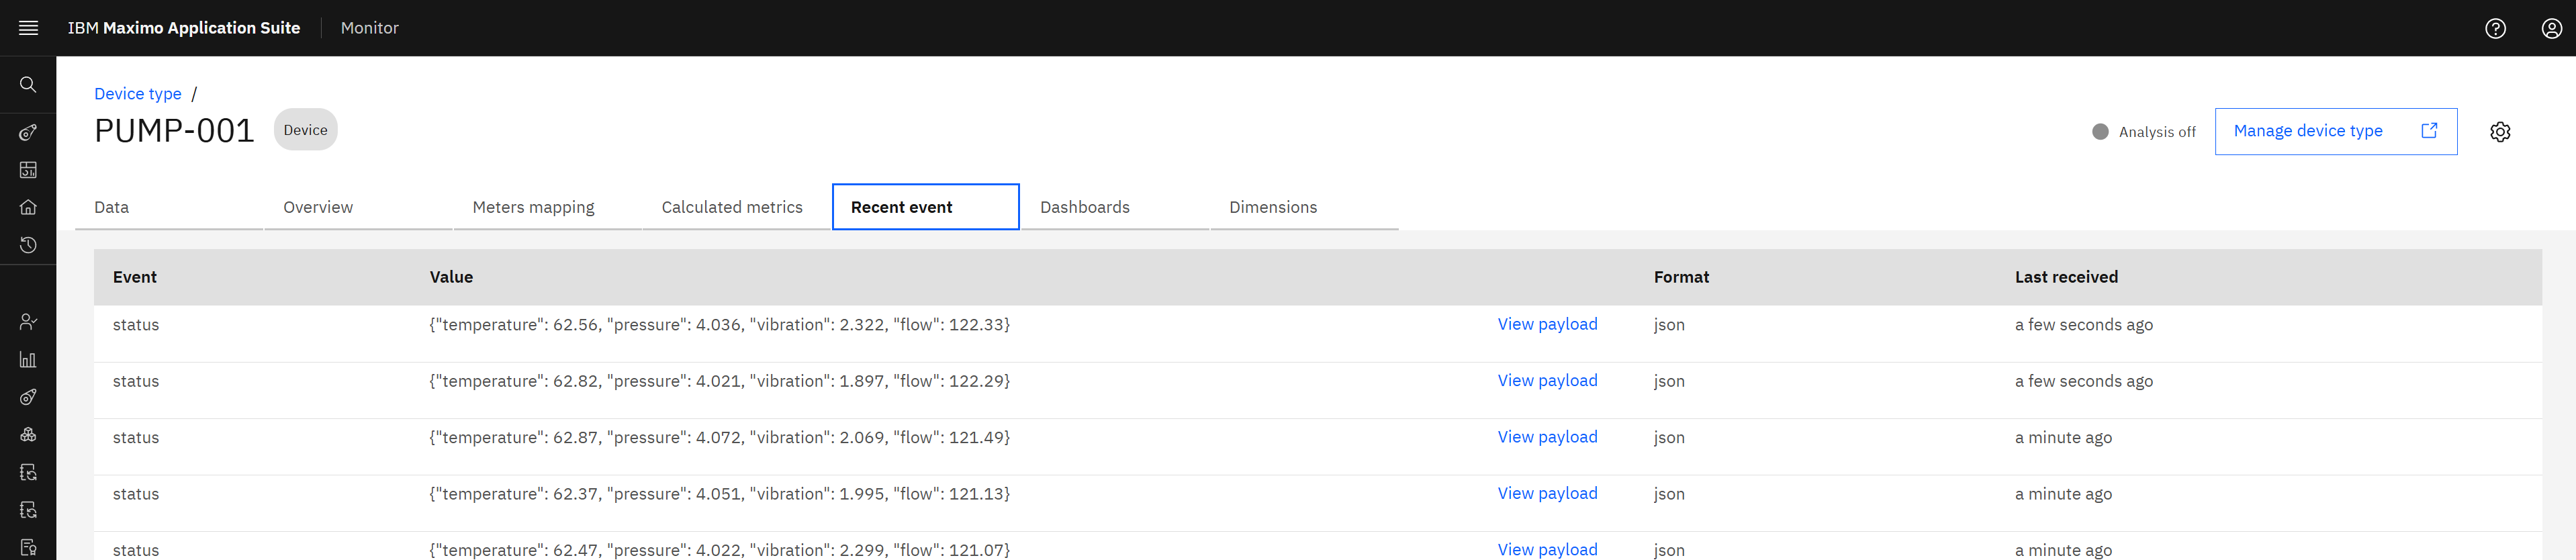
Step 6. Find the same reading in Kafka. This is the step that makes the architecture real. Read the end of the
topic instdb2_topic_events with a few lines of Python (same kc.py as in exercise 1):
Shell$ python peek.py instdb2_topic_events 2
partition 0: offsets 0..0
partition 1: offsets 0..3
partition 2: offsets 0..0
p1 o1 key=b'…\x00\x03wsp\x00\x0bCoolingPump\x00\x08PUMP-001\x00\x06status\x00\x04json'
   value=b'{"temperature": 62.37, "pressure": 4.051, "vibration": 1.995, "flow": 121.13}'
p1 o2 key=b'…\x00\x03wsp\x00\x0bCoolingPump\x00\x08PUMP-001\x00\x06status\x00\x04json'
   value=b'{"temperature": 62.87, "pressure": 4.072, "vibration": 2.069, "flow": 121.49}'
The value is the device's JSON, untouched. The key carries the workspace, the device type, the device ID, the event name and the format. Because the device is part of the key, all readings of one pump land in the same partition (here partition 1) and stay in order. That is the rule from exercise 1, applied by IBM.
Before the first message the topic's offsets were all 0: the system had never received a device event. After three publishes, partition 1 stood at offset 3. You have followed one reading across three technologies.
The client ID does not match the registration. Type and device ID are case sensitive. The broker closes the connection without a helpful message.
Two programs use one client ID. MQTT allows one connection per client ID. The second one throws the first one out, they take turns, and the data looks patchy.
The JSON field is not a metric. A field called temp does not fill a metric called
temperature. The event still arrives (you see it under Recent event) but the metric stays empty.
MQTT or Kafka? The question behind most confusion
Both "send messages to topics", so they sound like rivals. They are not. They solve opposite halves of the same journey, and almost every industrial architecture uses both, in this order: MQTT from the device to the first server, Kafka from that server to everything else.
| MQTT | Kafka | |
|---|---|---|
| Built for | Getting data off many small, weak, far-away things. | Moving and keeping large streams of data between applications. |
| Who connects | Sensors, controllers, gateways, phones. Thousands to millions of clients, each sending little. | Applications and services in the data centre. Tens to hundreds of clients, each sending or reading a lot. |
| The client | Tiny. Fits in a microcontroller. A few lines of code, one open connection. | Heavy. A full library that talks to several brokers and tracks partitions and offsets. |
| The network it expects | Bad. Mobile links, radio, links that drop. It has keep-alive, automatic reconnect and a "last will" message for a device that vanishes. | Good. A fast, stable network inside or between data centres. |
| What the broker keeps | Almost nothing. It passes a message to whoever is subscribed now. At most it remembers the last value of a topic. | Everything, for the retention time. Messages stay on disk whether or not anyone has read them. |
| Reading again | Not possible. A message that was delivered is gone. | Normal. Any consumer can go back to an old offset and read the stream again. |
| Several readers | Every subscriber gets its own copy as it arrives. | Each consumer group reads at its own pace and keeps its own position. |
| Order | Per topic, per connection. | Per partition, and it is kept on disk. |
| Topics look like | A path with levels and wildcards: iot-2/evt/status/fmt/json. | A flat name with partitions: instdb2_topic_events, partition 1. |
| Who is who | Each device has its own identity and token, so one stolen sensor can be switched off alone. | A few service accounts with permissions on topics. |
| Typical message | "Pump 1, vibration 2.1." Small, frequent. | The same reading, plus millions like it, plus business events. |
Between equipment and the first server: sensors, PLC gateways, vehicles, meters, anything on a mobile or radio link, anything battery-powered, anything you must identify one by one.
Between applications: feeding Monitor, a data lake and an analytics tool from one stream; surviving an outage of the consumer; replaying history; high volume at high speed.
MQTT collects, a bridge writes to Kafka, Kafka distributes. That is exactly what the IoT tool of the suite does, and what you watched in exercise 2.
Kafka on the device. A sensor cannot run a Kafka client sensibly, should not hold a Kafka account, and should not be able to reach your central brokers at all.
MQTT as the backbone between applications. Nothing is stored, so a consumer that is down for an hour has lost an hour, and a new system cannot be given yesterday's data.
You have already seen every row of that table in this guide. The pump script connected with a device identity and a token and published one small JSON document: MQTT. The same document then sat in a file on a broker's disk at offset 17, read by Monitor's consumer group and readable again by yours: Kafka.
Part 5Gateways: how plant data reaches the suite
A pump does not speak MQTT, and it certainly does not hold a token. In a real plant something stands between the equipment and the suite. That something is called a gateway, and the word covers several quite different things. The question to ask is always the same: who holds the connection, and who is known to the suite?
| Way in | How it works | Use it when | Watch out for |
|---|---|---|---|
| Direct device | The device is an MQTT client with its own ID and token. Exercise 2. | Modern sensors, a Raspberry Pi, a test script, a system you program yourself. | One secret per device to distribute and rotate. |
| IoT gateway | The gateway is registered as a special device. It opens one connection and publishes on behalf of the devices behind it, naming each one in the topic. Its client ID starts with g: instead of d:. | Many simple sensors on a local radio or serial network; one box per site that already collects them. | If the gateway is down, every device behind it is silent. Buffer on the gateway. |
| Edge data collector | Software at the plant that reads industrial protocols such as OPC UA and Modbus from PLCs and SCADA, and forwards the values. Monitor has a configuration service for it. | Brownfield plants, where the data is in controllers, not in sensors you can reprogram. | Tag mapping. A PLC has thousands of tags with cryptic names; deciding which tag is which metric of which asset is the real work. |
| File or API feed | No MQTT at all. Data is loaded into Monitor from CSV files, through its REST API, or by a connector to a system that already holds it. | History to back-fill, low-frequency data, a historian or building system that is already the source of truth. | It is batch, not live. Agree how late "late" may be. |
In Monitor a gateway is registered under Setup > Gateways > Add gateway. Like a device it gets an ID, a type and a token. The form then asks one question that devices do not have: its Configuration.
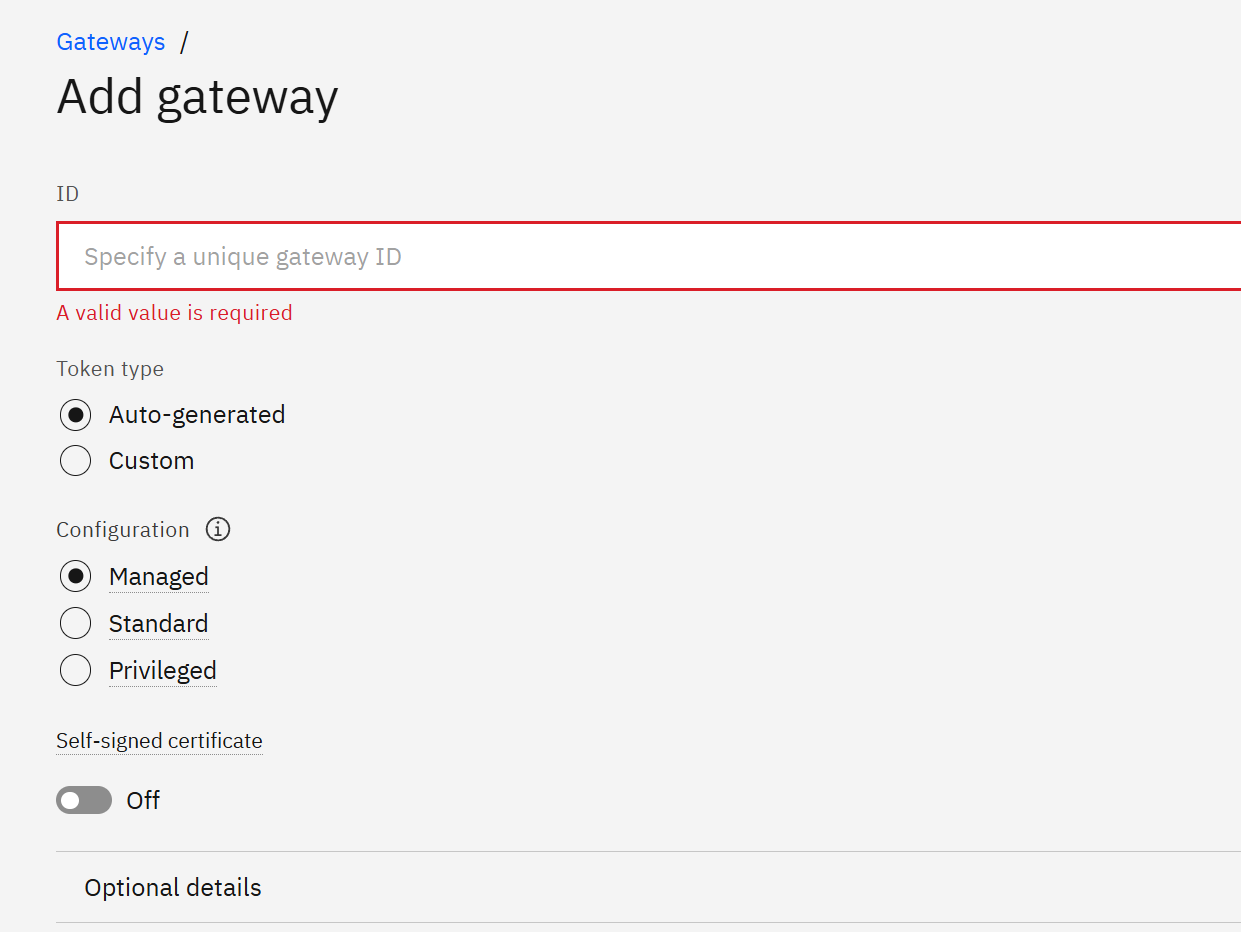
| Configuration | What Monitor says about it | In practice |
|---|---|---|
| Managed | "This gateway contains devices from the device library." | A product Monitor knows. You pick the gateway and its devices from the library of preconfigured, manufacturer-specific equipment, with their metrics already defined. |
| Standard | "This gateway contains custom devices." | Your own gateway in front of your own device types. This is the kind you choose in the Add device dialog of exercise 2, whose small print reads: custom devices must be added to a non-managed gateway. |
| Privileged | No tooltip in the form. | In the IoT platform this suite grew from, a privileged gateway may speak for any device and register new ones by itself. That is convenient and powerful; give it only to a gateway you fully control. |
The device library: when someone has already done the modelling
In exercise 2 everything about the pump was typed by hand: the device type, the event, four metrics and their units. That is fine for one pump you invented. It is slow and error-prone for a real drive or power meter that exposes dozens of values in numbered registers. For those, Monitor ships a device library: a catalogue of real, manufacturer-specific products, each with its protocol settings and its metrics already described.
The way in is the same Add device button. The dialog offers two tiles, Use device library and
Add custom device. The first one has a condition printed under it: "Only managed gateways are available.
Library devices must be added to a managed gateway." On this system the list was empty until a gateway with the
Managed configuration existed, so one was created first (ID EDGE-GW-01, type
EdgeGateway). After that, Continue opens a wizard of five steps.
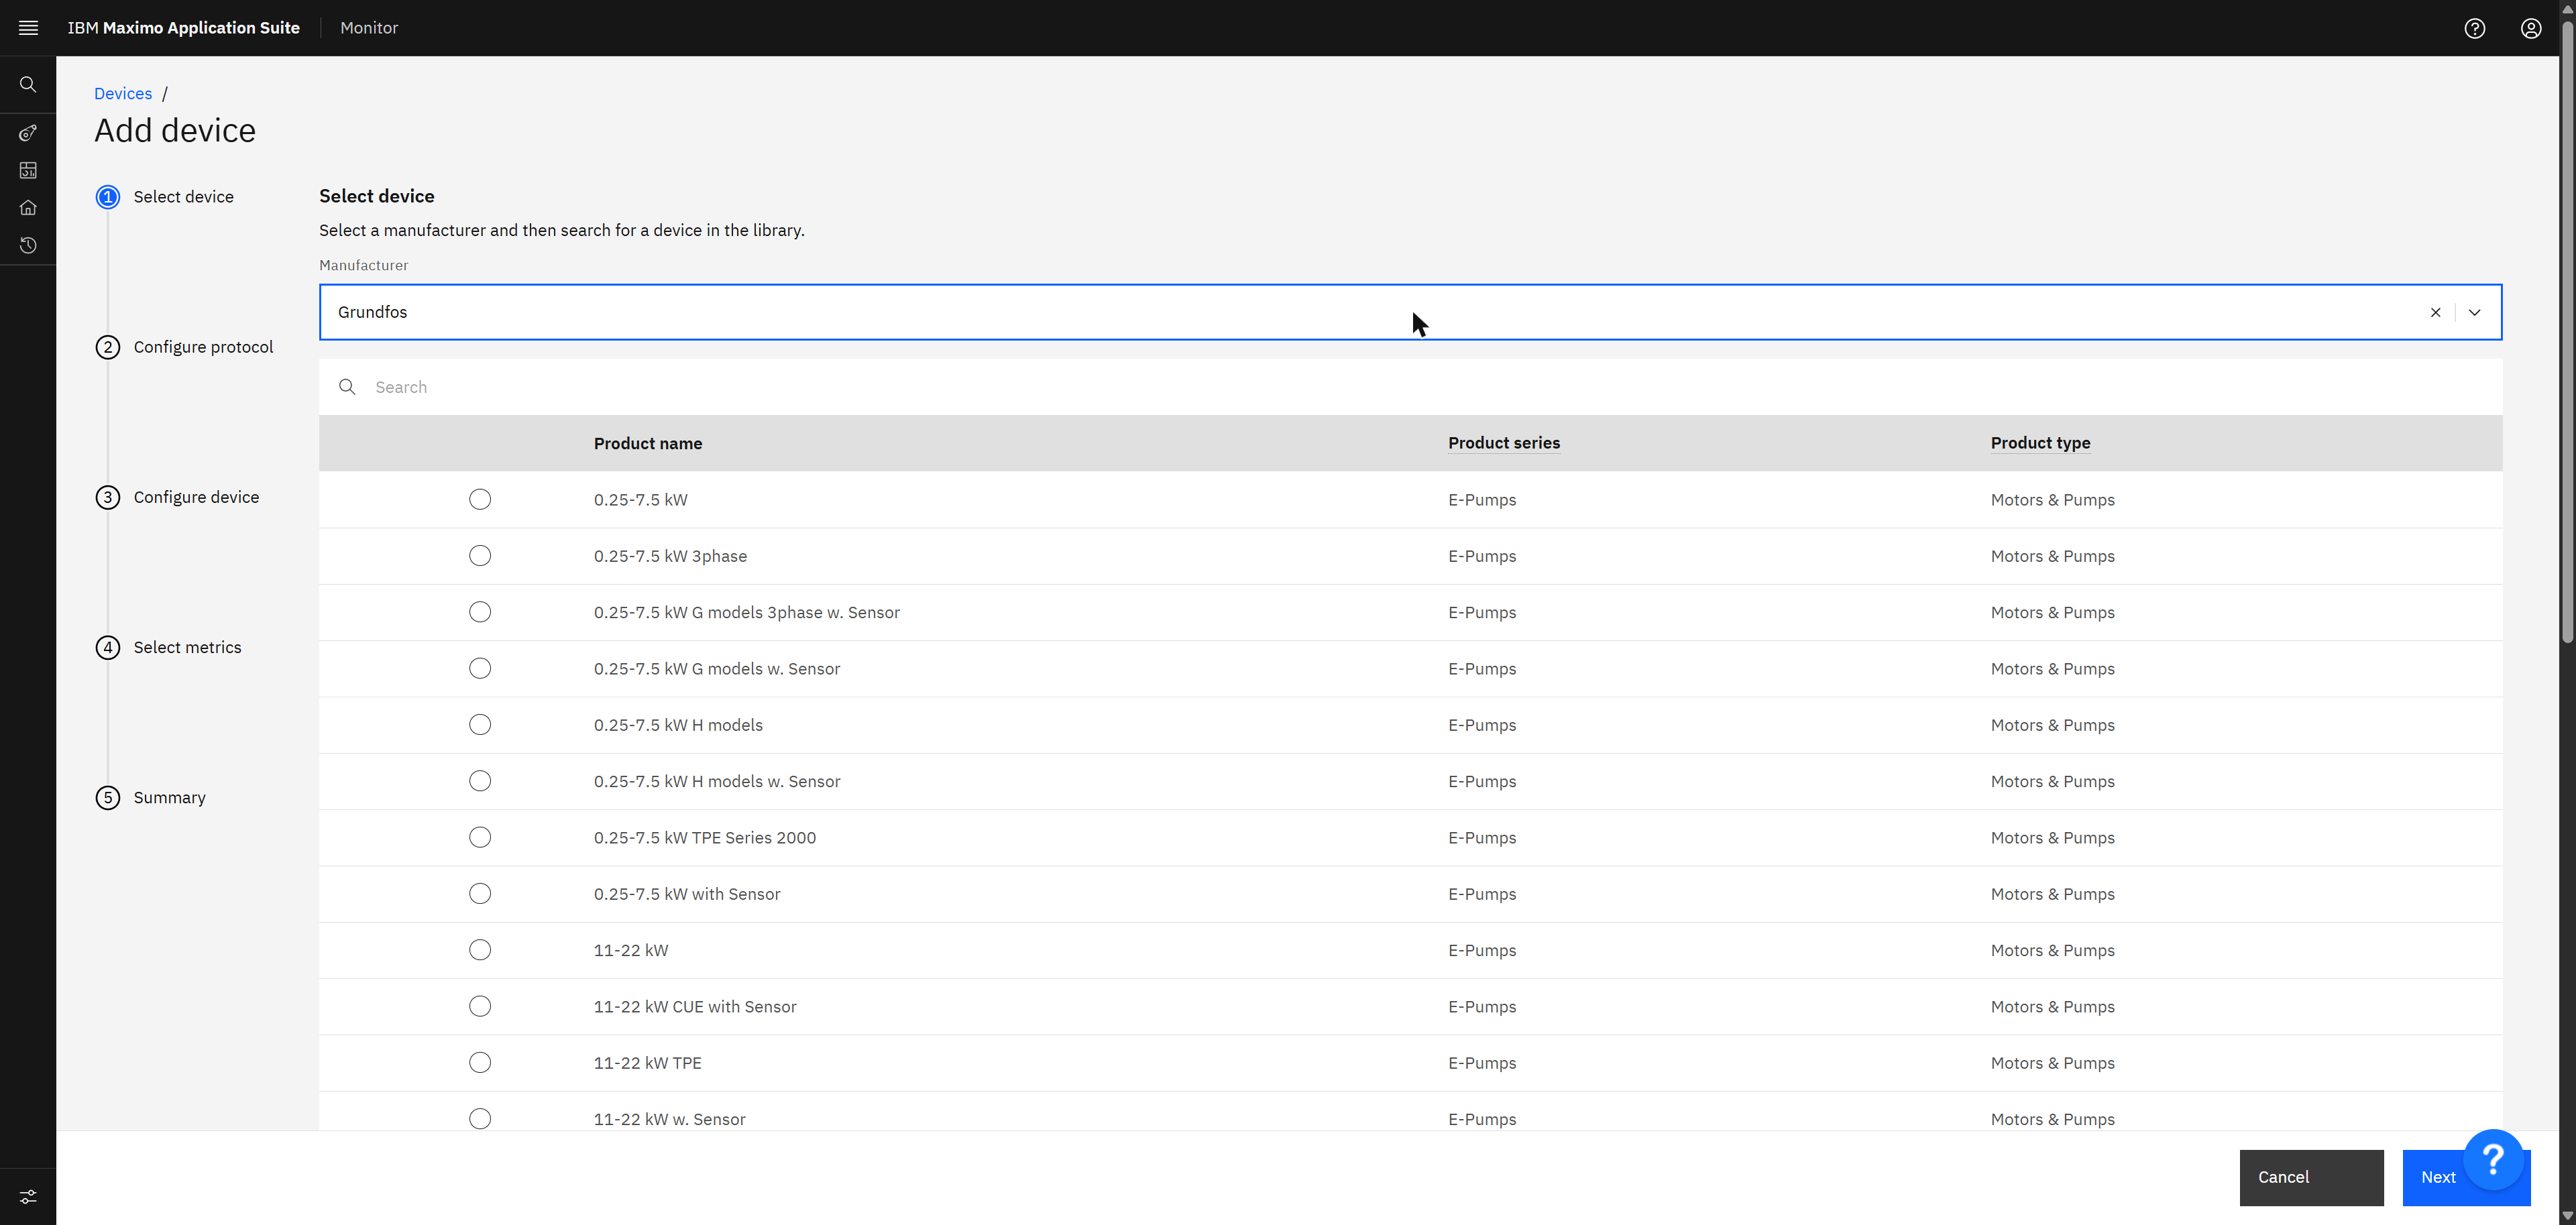
| Step | What you do | What was on screen for a Grundfos E-Pump |
|---|---|---|
| 1. Select device | Pick the manufacturer, then the product. | Product type "Motors & Pumps". |
| 2. Configure protocol | Say how the gateway reaches this unit. | Protocol Modbus RTU, with the serial settings prefilled: baud rate 19200, parity None, 8 data bits, 1 stop bit, server ID 1. You only add the port. |
| 3. Configure device | Give it a device ID and a device type, as for any device. | The product type is carried over. |
| 4. Select metrics | Tick the values you want and how often to send them. | 39 metrics offered, with units. |
| 5. Summary | Review and create. | Not completed here: there is no real pump on the other end. |
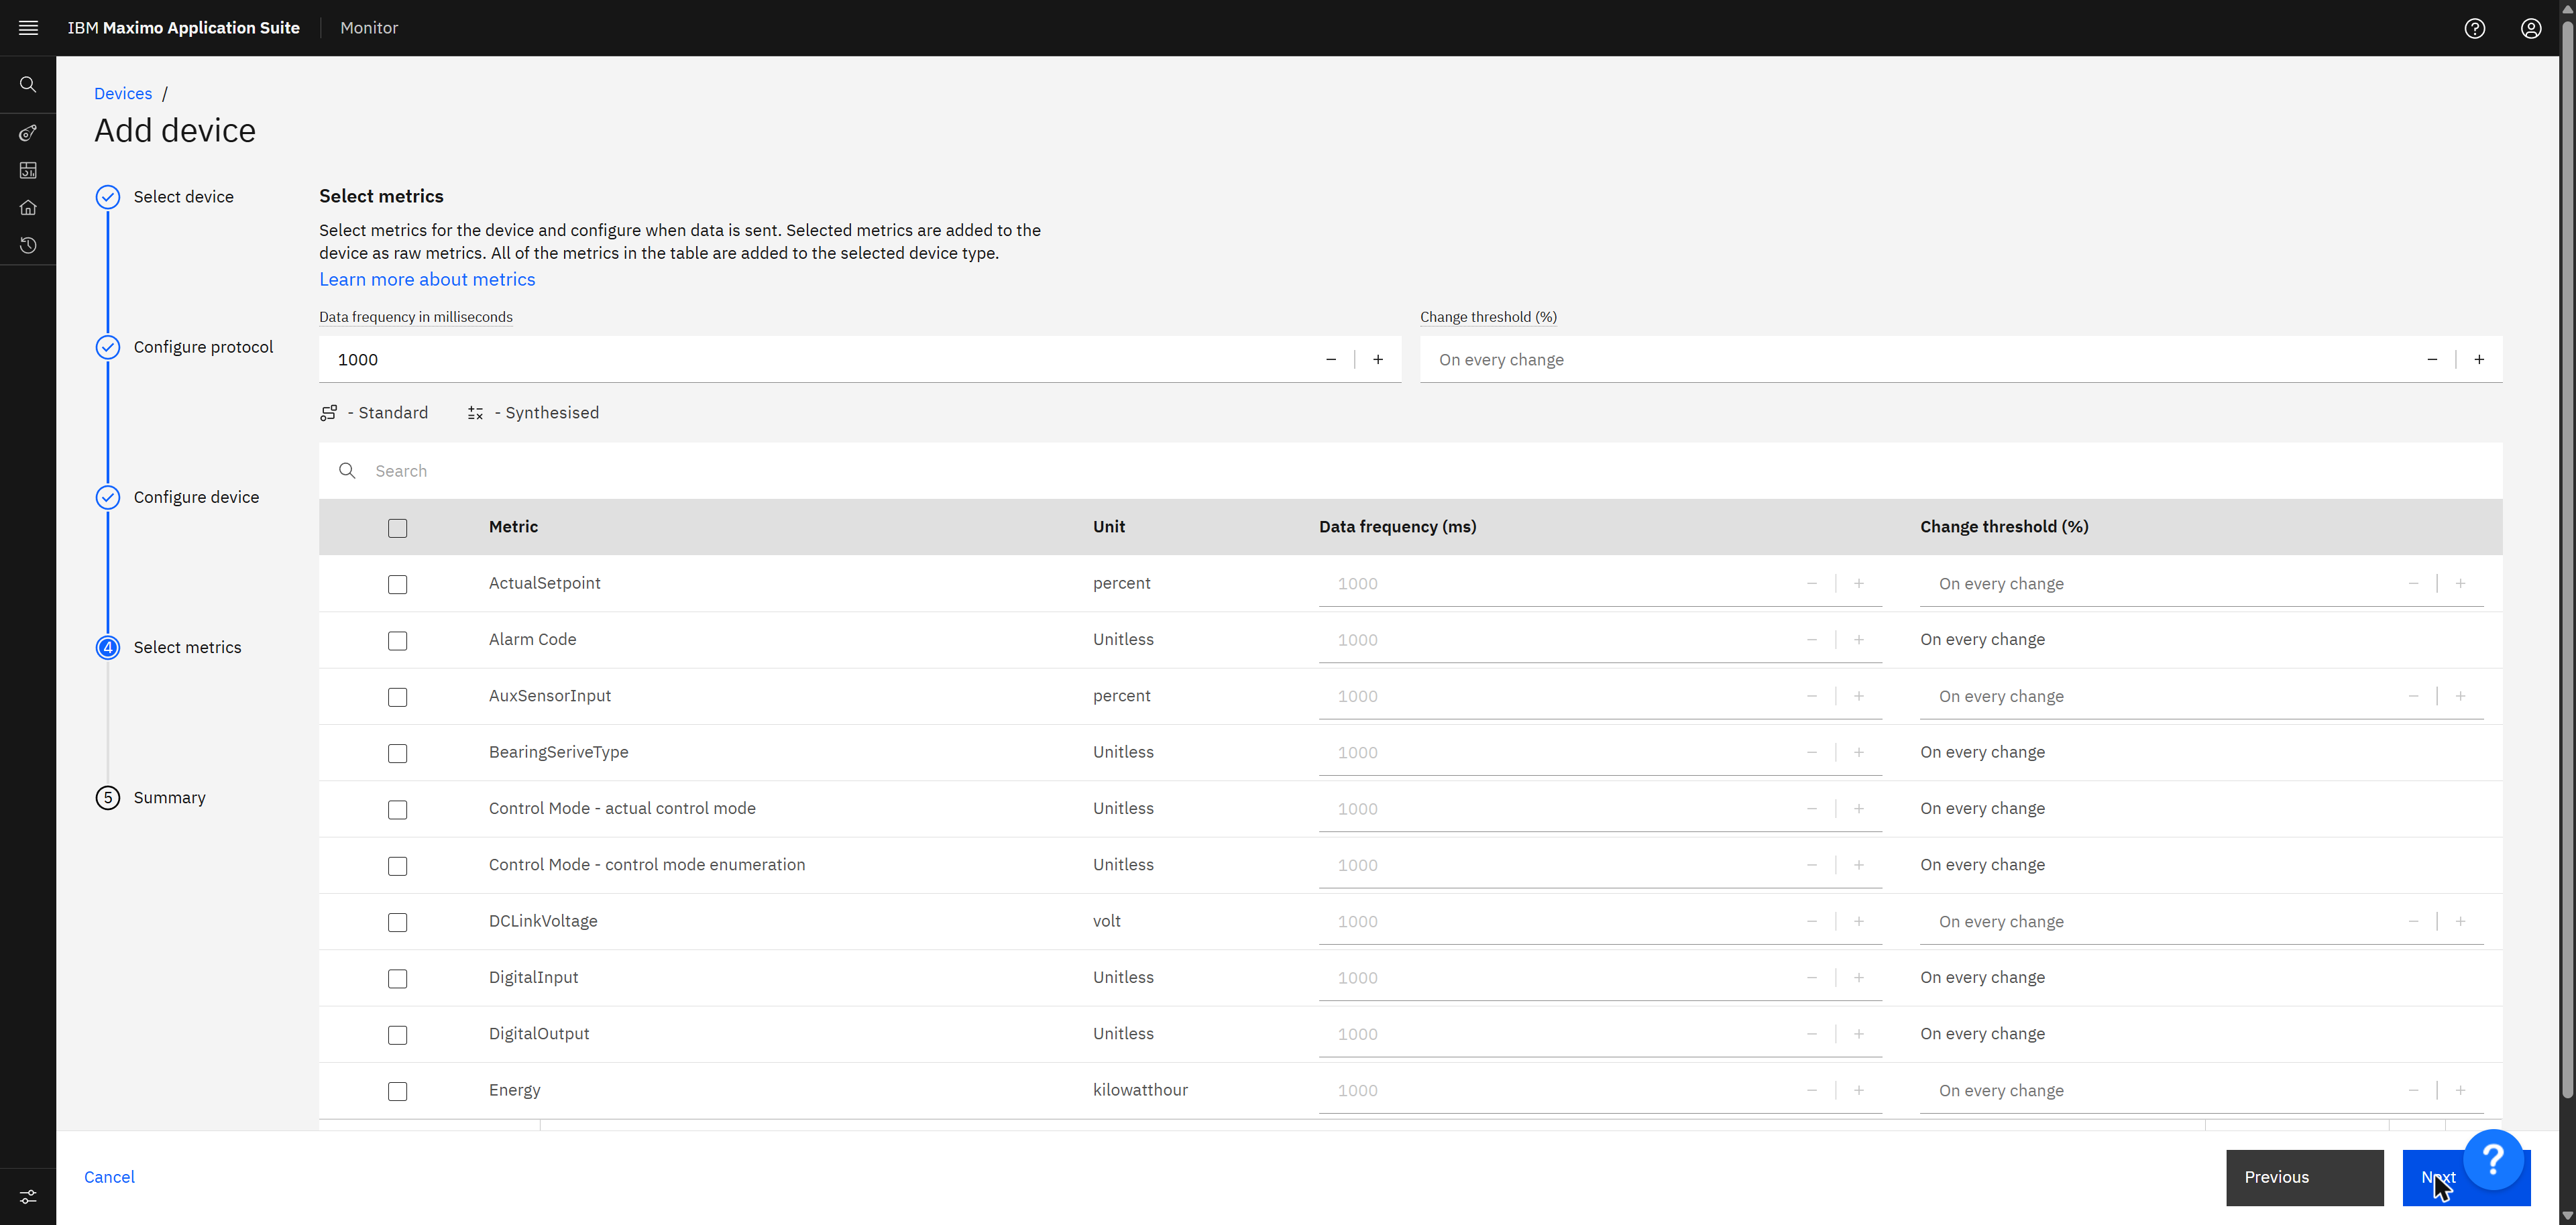
Two details on that last screen are worth understanding. Data frequency is how often the gateway reads the value. Change threshold is how much it must change before it is worth sending; "On every change" sends each new value. Together they decide how much traffic one pump creates, which matters when there are five hundred of them on one site network.
The library only describes the device. The reading is done by a small container, the Edge Data Collector, that you run on the gateway or on an edge computer next to the equipment. IBM's documentation gives the requirements: anything that runs Linux and Docker 19 or later, about 2 GB of memory, 512 MB of disk, and an Ethernet or serial port to reach the devices. It also says that PLC and OPC UA devices from certain manufacturers can be added, and that an administrator can add custom entries to the library. Details: Device library in the IBM Maximo Monitor documentation.
| Custom device (exercise 2) | Library device | |
|---|---|---|
| Who defines the metrics | You, one by one. | The library entry. |
| Who speaks to the suite | The device itself, or your own gateway. | A managed gateway running the Edge Data Collector. |
| Protocol at the plant | Whatever your code speaks; MQTT towards the suite. | The product's own, such as Modbus or OPC UA, read by the collector. |
| Good for | New sensors, scripts, anything you can program. | Existing drives, meters, pumps and controllers you cannot reprogram. |
The fourth way in has its own page too: Setup > Data ingestion is a list of uploaded files, with the device type each one fed, its status and its record count.
Push intelligence to the edge only as far as needed. If the plant network is reliable and the equipment can speak MQTT, connect it directly and keep the edge simple. Add a gateway when the protocol, the network or the security zone forces you to, not because the diagram looks more serious with one.
Exercise 5: Node-RED, the pump redrawn as a flow
Exercise 2 used forty lines of Python to be a pump. Plenty of people who need to connect equipment do not write Python. Node-RED is the tool they reach for. It is open source, it started at IBM and now lives at the OpenJS Foundation, and it runs anywhere from a laptop to a small industrial gateway. You work in a browser: drag nodes from a palette onto a canvas, join them with wires, and press Deploy. A message travels along the wires from left to right, and each node does one thing to it.
| Node-RED word | Meaning | Seen in this exercise |
|---|---|---|
| Node | One step: receive, change or send a message. | inject, function, mqtt out, debug, http in |
| Wire | The path from one node's output to the next node's input. | The grey lines |
| Flow | A tab of wired nodes. | "1 Pump simulator", "2 HTTP to MQTT bridge" |
| msg | The message object. Its content is in msg.payload, its subject in msg.topic. | The reading, and the MQTT topic |
| Configuration node | Settings shared by several nodes, such as one broker connection. | "Maximo IoT as PUMP-001" |
| Deploy | Make the drawn flows the running flows. | The red button, top right |
Get it running
One container is enough. This is the command, with podman on a Windows laptop; docker takes the same
arguments. (Here a folder on the laptop was mounted at /data in place of the named volume, which
makes no difference to the exercise.) The version that started was Node-RED 5.0.8.
Shell$ podman run -d --name nodered -p 1880:1880 -v nodered-data:/data docker.io/nodered/node-red:latest
$ podman logs nodered | grep -E "version|Started"
13 Oct 10:46:10 - [info] Node-RED version: v5.0.8
13 Oct 10:46:10 - [info] Node.js  version: v24.21.0
13 Oct 10:46:11 - [info] Started flows
The editor is then at http://localhost:1880.
Out of the box the editor has no login, and a function node can run any code on the machine. That is fine on
your own laptop. Before the address is reachable by anyone else, switch on adminAuth in
settings.js (a user and a hashed password), and httpNodeAuth if your flows expose HTTP
endpoints. The instance used here has both.
Flow 1: the pump, as five nodes
| Node | Type | What it does |
|---|---|---|
| every 5 seconds | inject | Starts a message on a timer. Its Repeat setting is "interval, every 5 seconds". |
| Build reading | function | A few lines of JavaScript that fill msg.payload with the four values and set msg.topic. |
| event: status | mqtt out | Publishes the message to Maximo IoT. The topic field is left empty so the node uses msg.topic. |
| reading | debug | Shows every message in the right-hand panel, so you see what was sent. |
| Start bearing fault, Clear fault, set flow.fault | inject, inject, change | Two buttons that store true or false in a variable of the flow. The function reads it. |
The function node holds the only code in the exercise:
JavaScript// One pump reading. While flow.fault is true the bearing wears a little more on every reading.
const fault = flow.get('fault') || false;
let wear = fault ? (flow.get('wear') || 0) + 0.25 : 0;
flow.set('wear', wear);
const t = Date.now() / 1000;
const jitter = (n) => (Math.random() - 0.5) * n;
msg.payload = {
    temperature: +(61 + 3 * Math.sin(t / 100) + jitter(1.2) + wear * 2.5).toFixed(2),
    pressure:    +(4.2 + 0.15 * Math.sin(t / 70) + jitter(0.1) - wear * 0.08).toFixed(3),
    vibration:   +(2.1 + jitter(0.5) + wear).toFixed(3),
    flow:        +(118 + 4 * Math.sin(t / 125) + jitter(2) - wear * 3).toFixed(2)
};
msg.topic = 'iot-2/evt/status/fmt/json';
node.status({ fill: fault ? 'red' : 'green', shape: 'dot', text: 'vibration ' + msg.payload.vibration });
return msg;
Everything that was a line of connection code in Python is a field in the mqtt out node's server settings. The values are the same five from exercise 2, because the device has not changed:
| Field in the MQTT server dialog | Value |
|---|---|
| Server, Port | <workspace>.messaging.iot.<your MAS domain>, 443 |
| Use TLS | On. In this lab the route has a self-signed certificate, so "Verify server certificate" is off in the TLS configuration. Leave it on in production. |
| Protocol | MQTT V3.1.1 |
| Client ID | d:wsp:CoolingPump:PUMP-001 |
| Security tab: Username | use-token-auth |
| Security tab: Password | The device token from exercise 2 |
Press Deploy. Under the mqtt node a green dot and the word connected appear, and the debug panel starts to fill. To break the bearing, click the small square on the left of Start bearing fault.
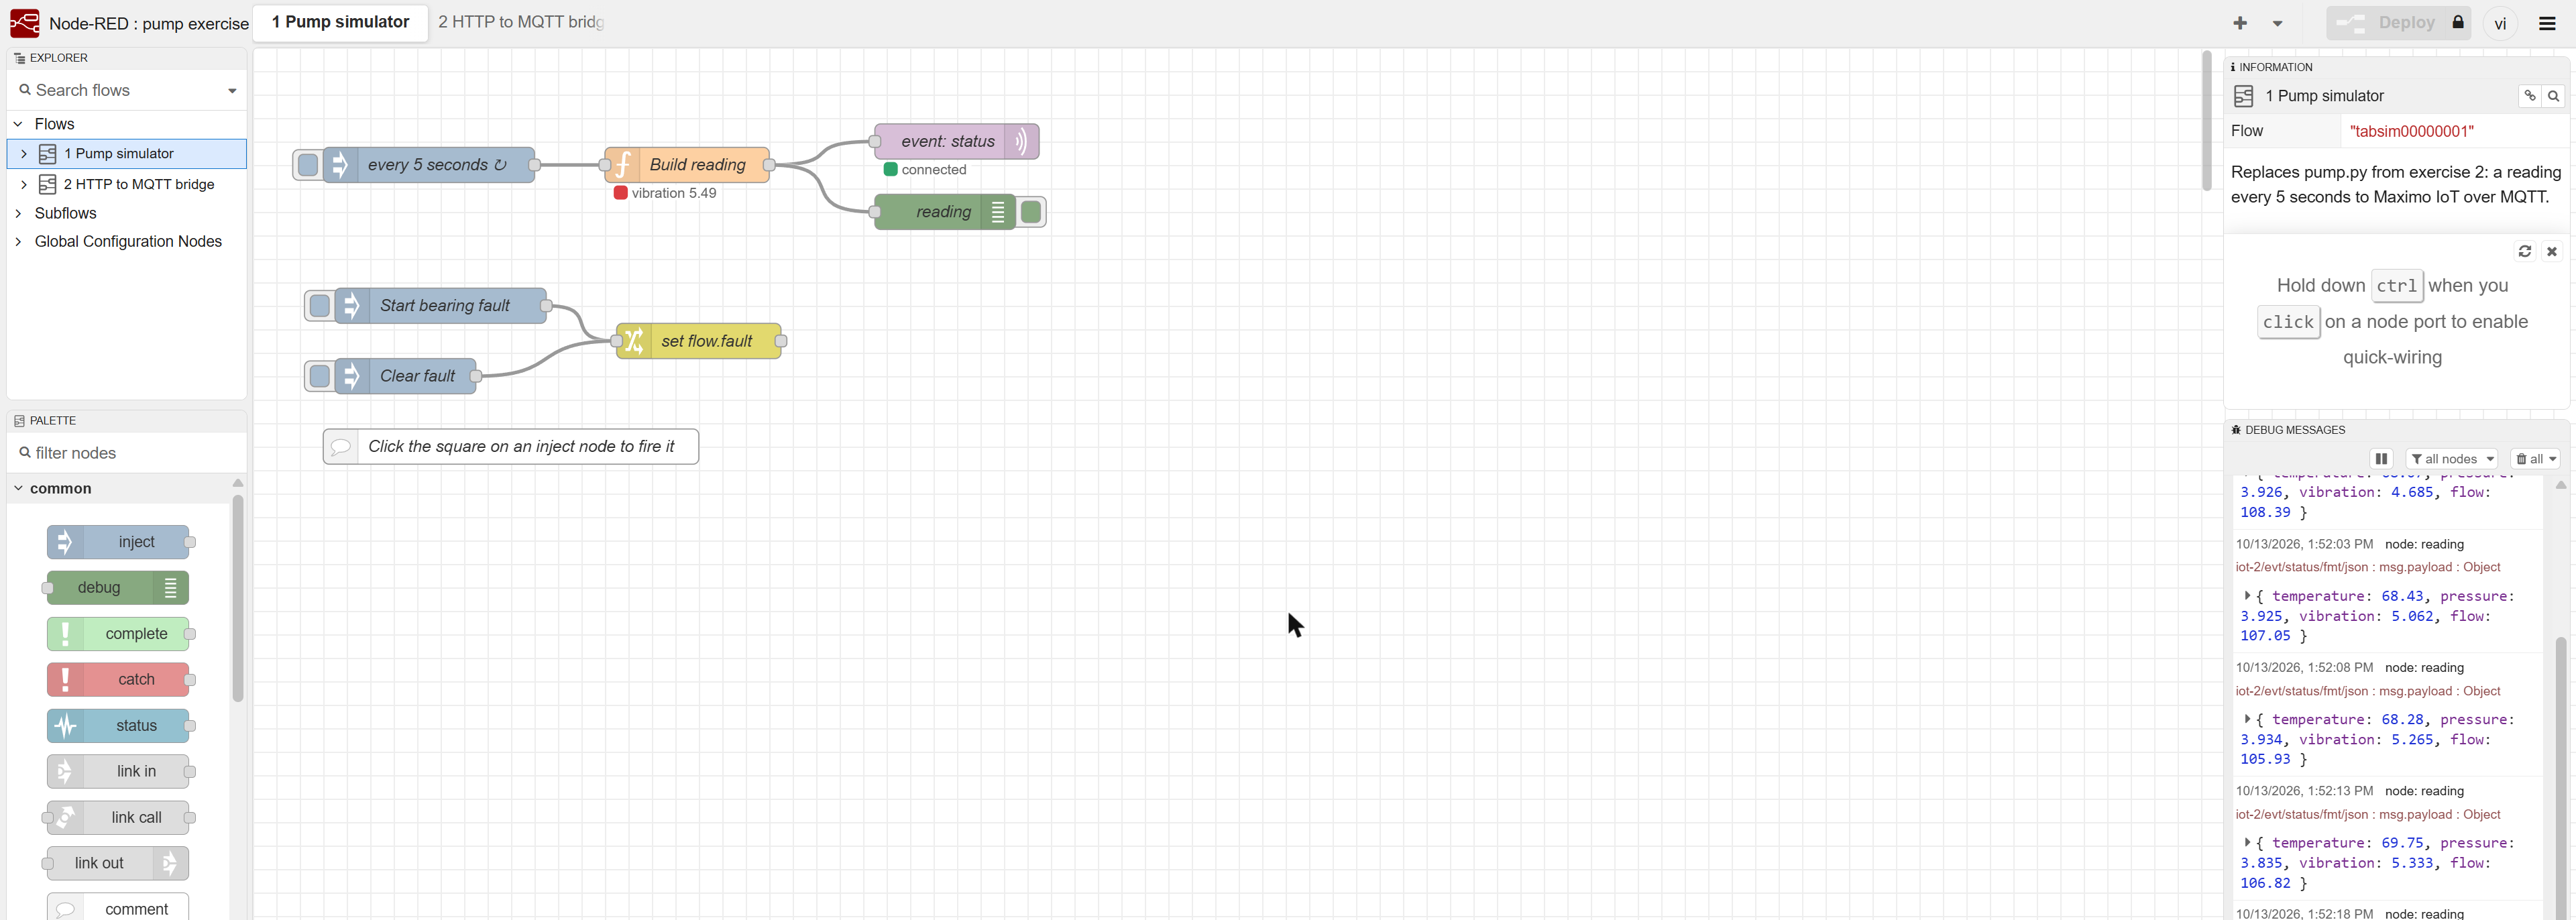
The Python script from exercise 2 had to be stopped first. Both it and Node-RED connect as
d:wsp:CoolingPump:PUMP-001, and a broker allows one connection per client ID: the newcomer pushes the
other one off, which then reconnects and pushes back. If an mqtt node flips between "connected" and "disconnected"
every few seconds, look for a second client using the same ID.
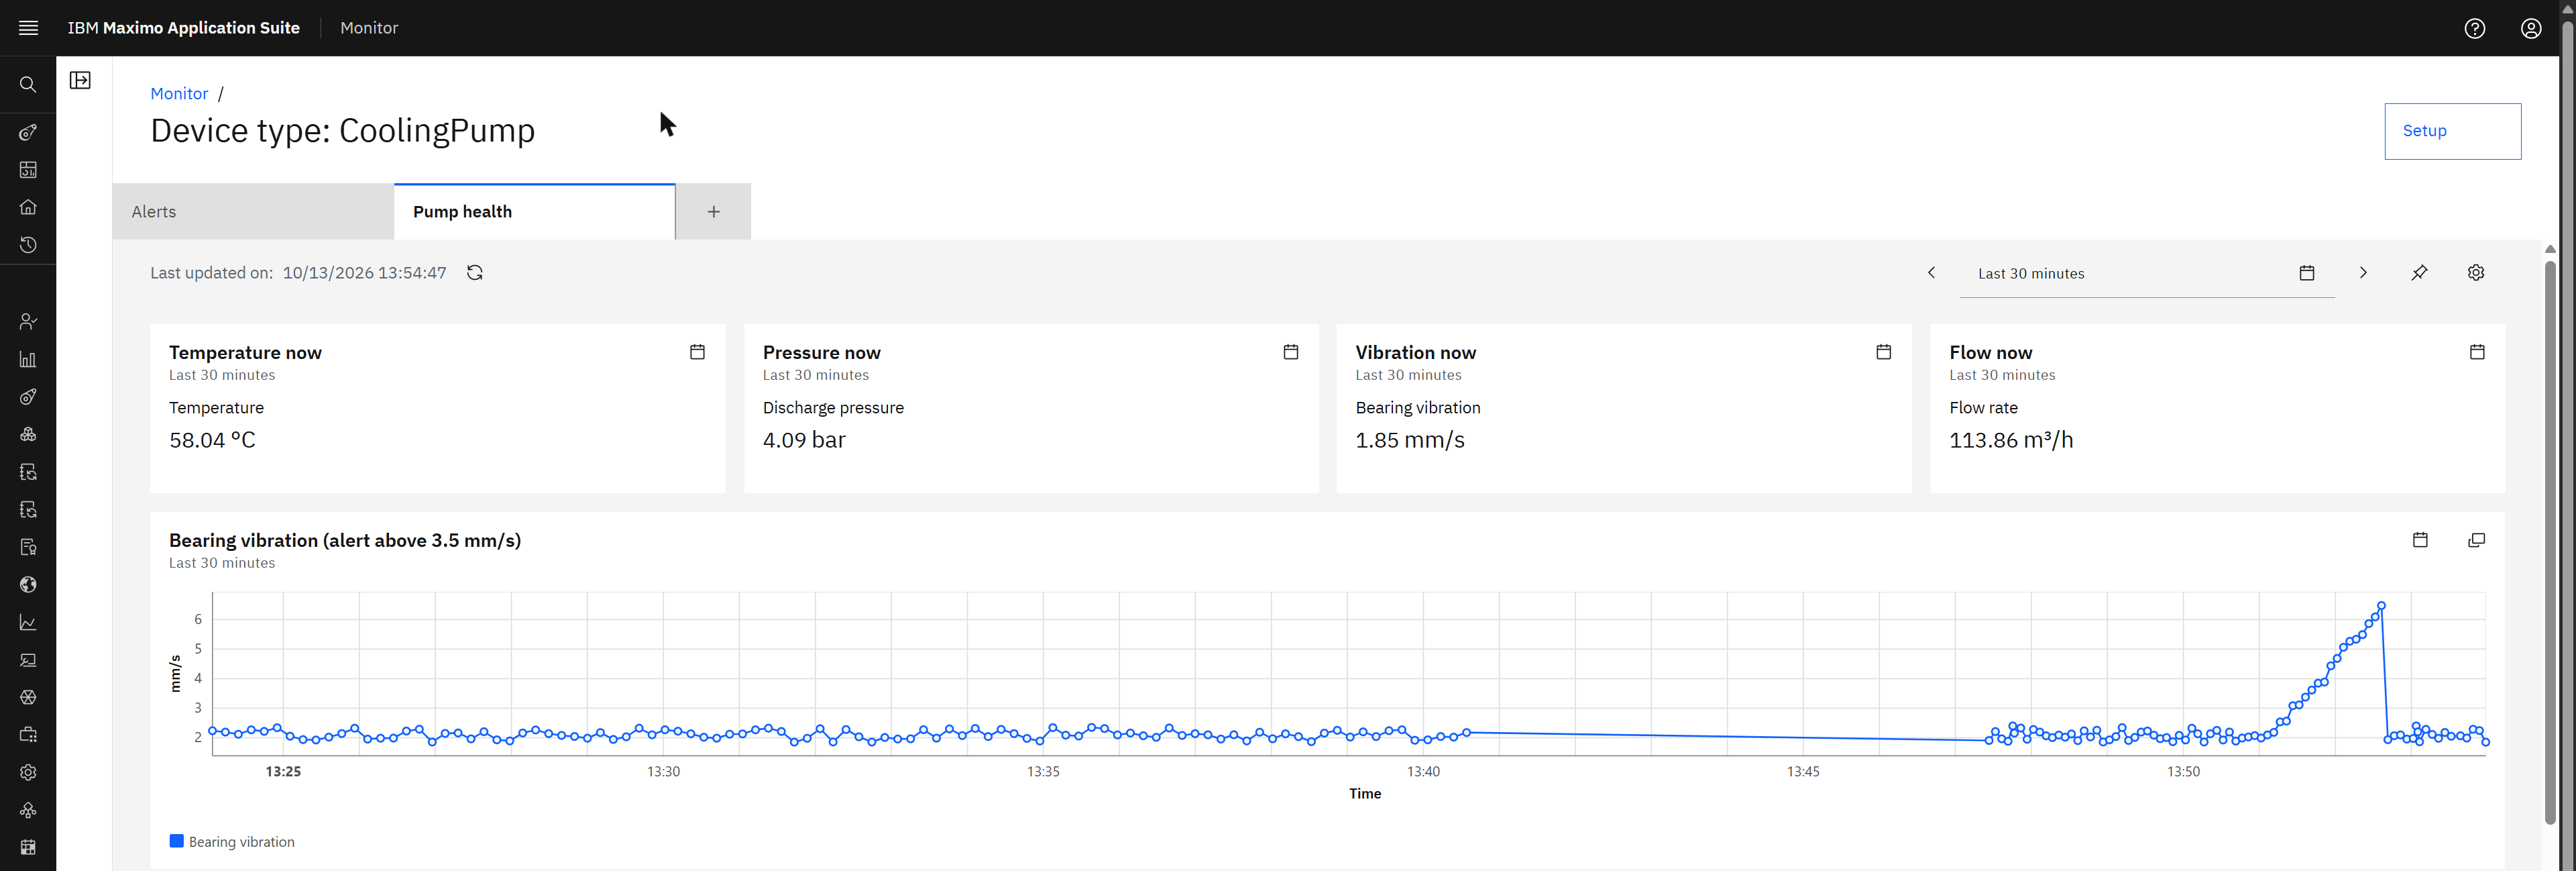
Monitor cannot tell who is on the other end. It sees a device called PUMP-001 sending status events,
exactly as before:
Flow 2: a small gateway
Part 5 said a gateway accepts data in whatever form the plant has and passes it on as device events. Here is one
in four nodes. Imagine an older system that can only send a line of text over HTTP:
temperature,pressure,vibration,flow.
| Node | Type | What it does |
|---|---|---|
| [post] /pump/reading | http in | Listens for an HTTP POST on that path. |
| CSV line to reading | function, two outputs | Splits the line, checks it, and sends the reading out of the first output and an answer out of the second. |
| event: status | mqtt out | The same server configuration as flow 1, so the same connection. |
| answer the caller | http response | Replies to whoever posted, with the status code the function chose. |
JavaScript// A legacy system posts one line of text: temperature,pressure,vibration,flow
const p = String(msg.payload).trim().split(',').map(Number);
if (p.length !== 4 || p.some(isNaN)) {
    msg.statusCode = 400;
    msg.payload = { error: 'expected: temperature,pressure,vibration,flow' };
    return [null, msg];
}
const reading = { temperature: p[0], pressure: p[1], vibration: p[2], flow: p[3] };
const toIot = { topic: 'iot-2/evt/status/fmt/json', payload: reading };
msg.statusCode = 202;
msg.payload = { accepted: true, device: 'PUMP-001', reading: reading };
return [toIot, msg];
Three calls show the three behaviours: no login, a good line, a bad line.
Shell$ curl -s -o /dev/null -w "%{http_code}\n" -H "Content-Type: text/plain" -d "70.5,3.9,2.4,111" http://localhost:1880/pump/reading
401
$ curl -s -u pump:<password> -H "Content-Type: text/plain" -d "70.5,3.9,2.4,111" http://localhost:1880/pump/reading
{"accepted":true,"device":"PUMP-001","reading":{"temperature":70.5,"pressure":3.9,"vibration":2.4,"flow":111}}
$ curl -s -u pump:<password> -H "Content-Type: text/plain" -d "hello" http://localhost:1880/pump/reading
{"error":"expected: temperature,pressure,vibration,flow"}
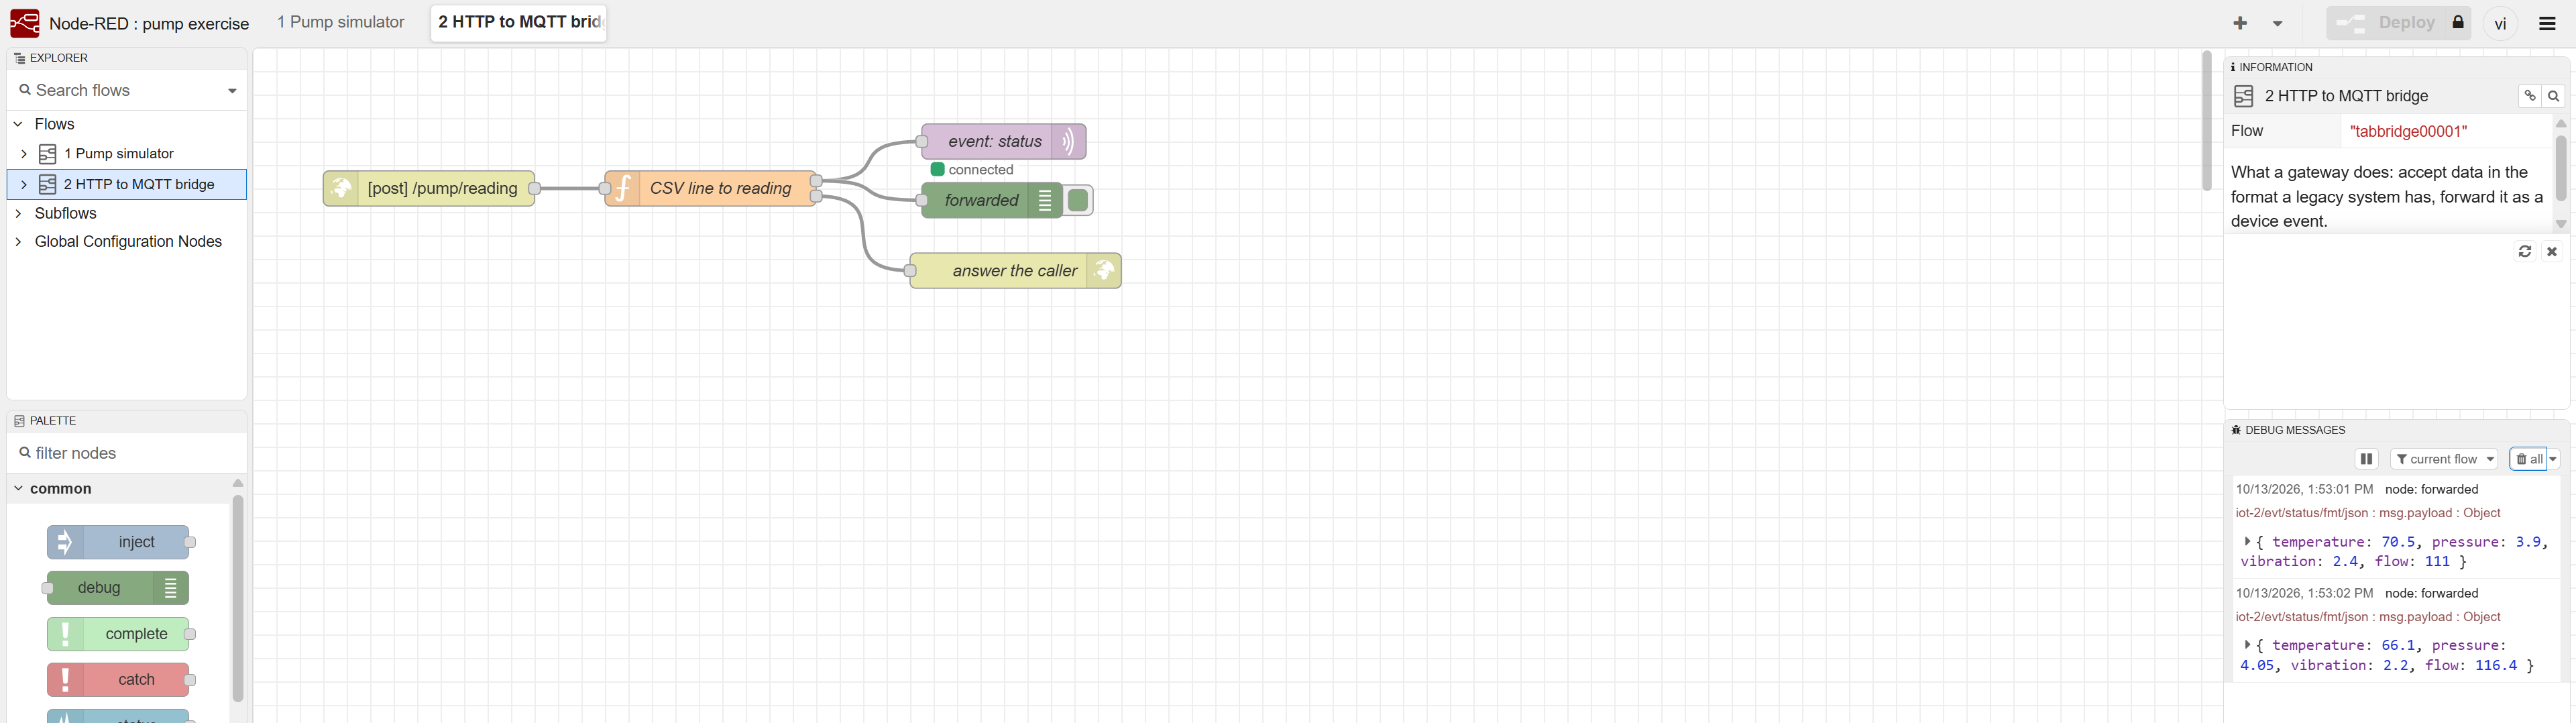
That is a gateway in miniature: a protocol the suite does not speak on one side, MQTT on the other, and a place in the middle to check and reshape the data. A bad line is refused at the door with a 400 and never reaches Monitor.
Where Node-RED fits, and where it does not
| Good at | Not the tool for |
|---|---|
| Simulating devices for a demo or a test, as here. | Thousands of messages per second. One Node.js process is not a Kafka cluster. |
| Translating at the edge: Modbus, OPC UA, serial, HTTP or files in, MQTT out. Community nodes exist for most industrial protocols. | Replacing MIF. Record-level integration with Manage belongs in object structures, channels and services, where it is tracked and can be reprocessed. |
| Glue that would otherwise be a script nobody maintains: a visible flow is easier to hand over. | Logic that must be reviewed and versioned like application code, unless you put the flow file under source control. |
| Trying an idea in an afternoon. | Holding messages safely through an outage. It keeps little in memory; put a broker or a queue behind it. |
Part 6Monitor: from readings to decisions
So far the readings only travel. Monitor is where they start to mean something. It does four things with them, in this order:
Every reading is kept with its device and its time, so a trend can be drawn for any period.
Functions turn raw readings into something useful: an hourly average, a difference, an anomaly score, an alert.
Dashboards per device, per device type, per site, built from cards without programming.
An alert becomes a service request or a work order in Manage, with the asset already filled in.
Step 1 of 3: look at the data
Open the device and its Data tab, then pick a metric, for example Bearing vibration. Monitor draws the trend for the chosen period: last 24 hours, last month, and so on. For a short period it does not draw every reading. It draws two lines per metric, the highest and the lowest value of each hour, which is the right view for spotting drift.
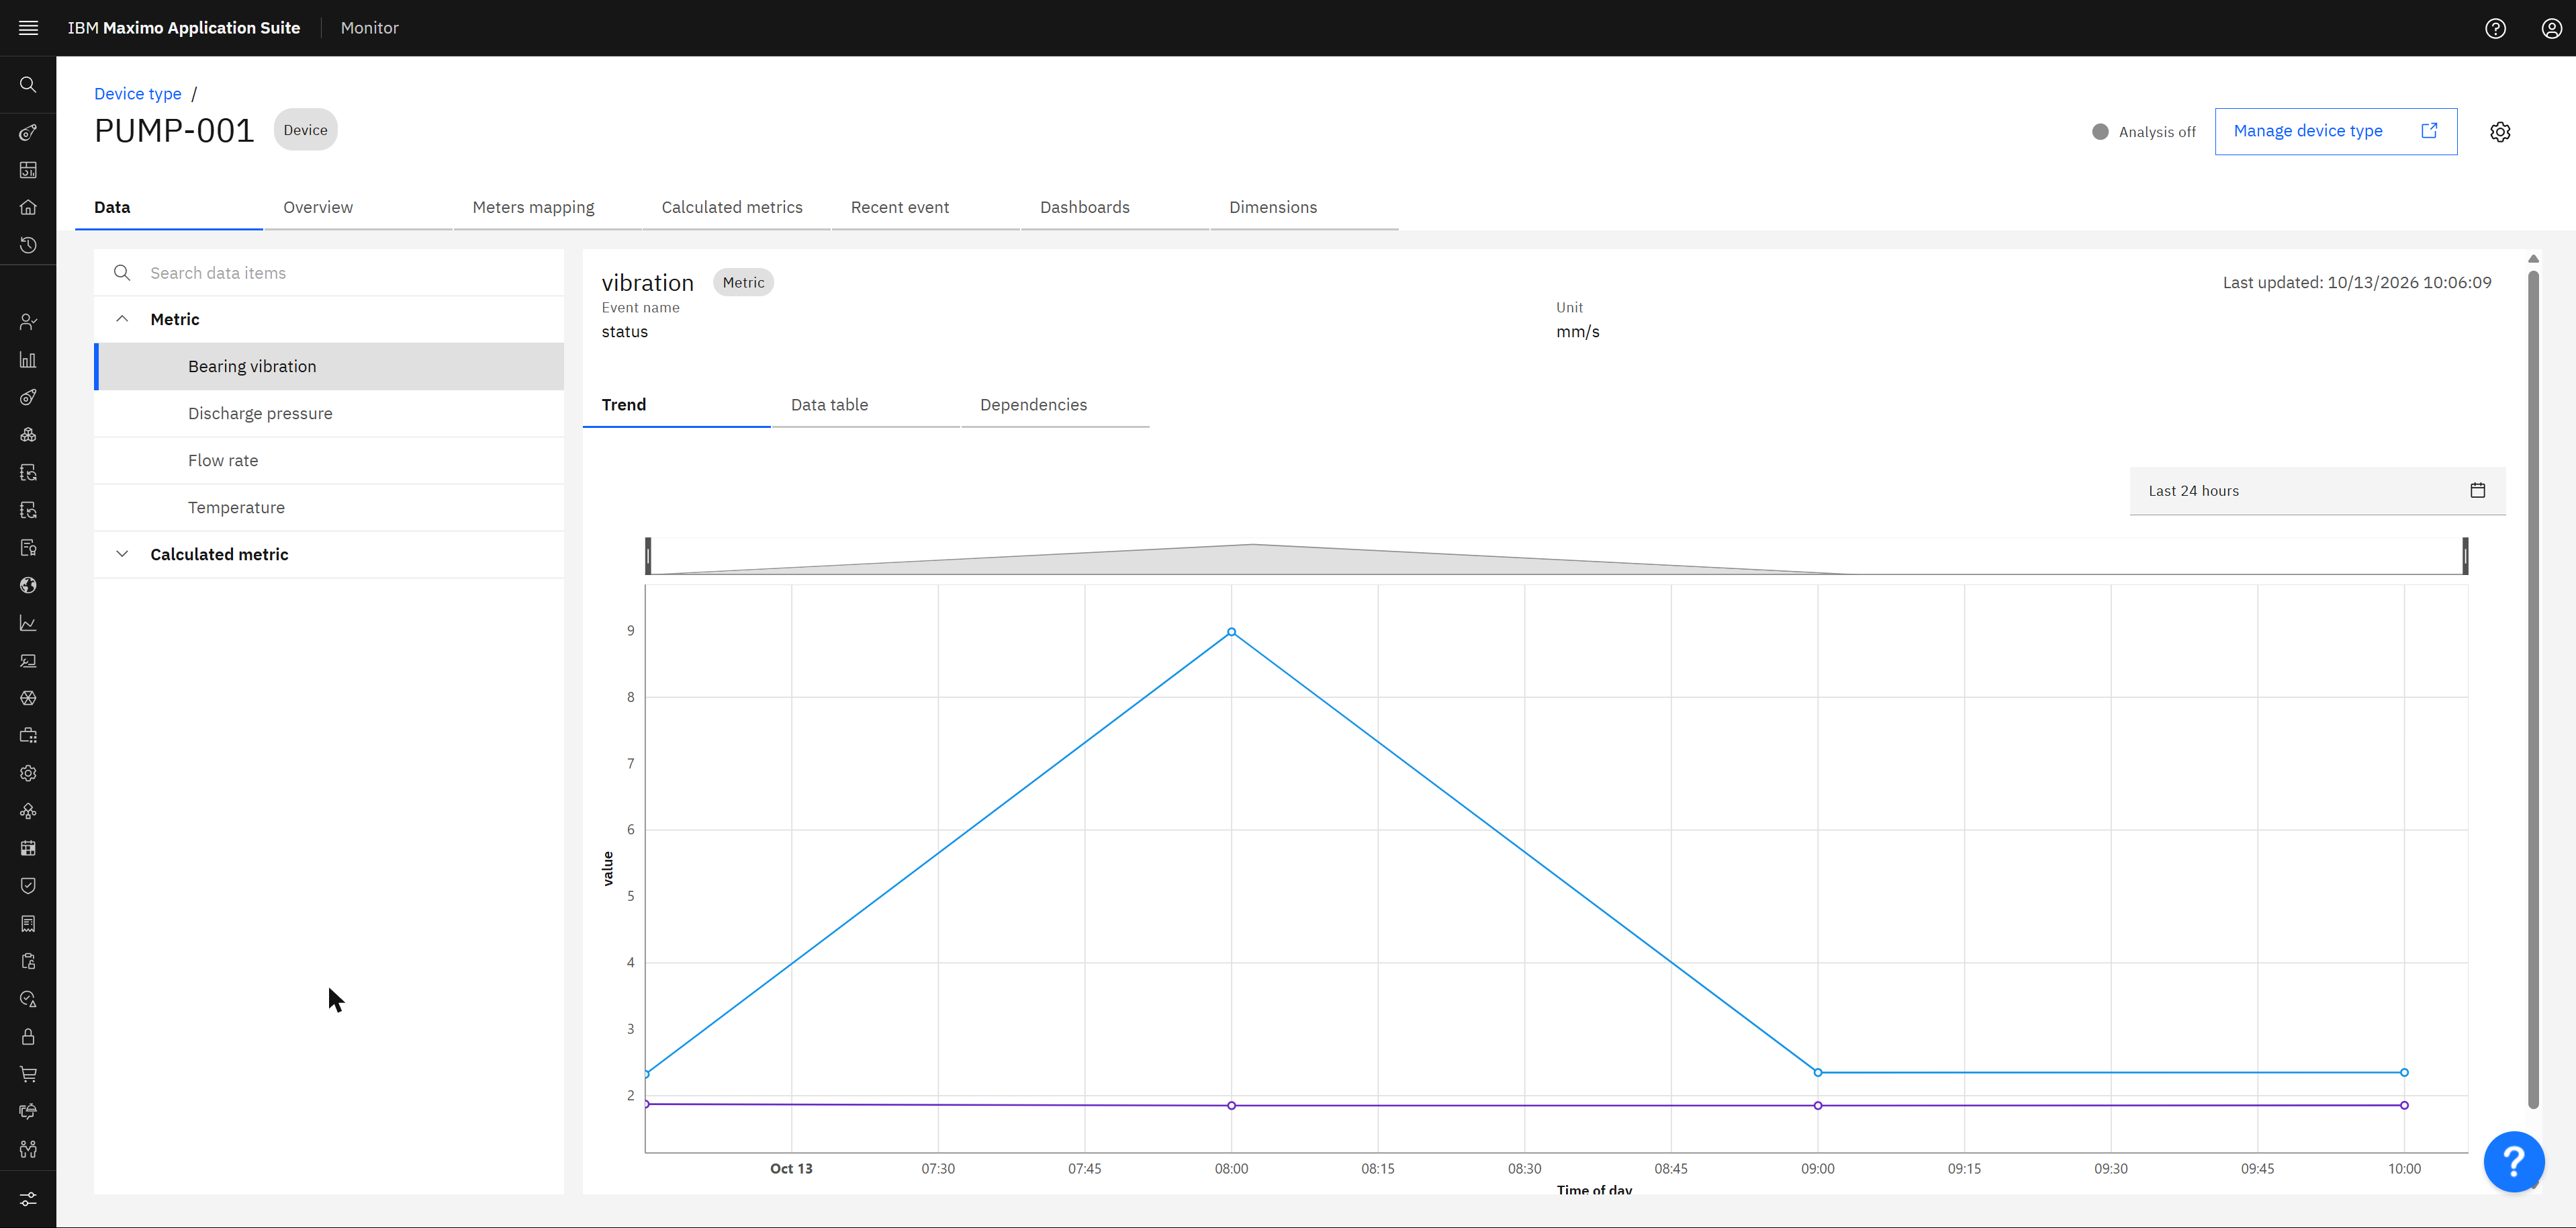
In this exercise the Python script played the part of a wearing bearing. After 25 minutes of normal operation it raised the vibration a little with every reading, from about 2 mm/s to more than 8, and let temperature rise and flow fall with it. Then the "repair" happened and the values went back to normal. On the trend, the maximum line climbs away from the minimum line. Nobody told Monitor about any of that. The question is whether the system can notice by itself.
Step 2 of 3: teach Monitor what "too high" means
On the device type, the tab Calculated metrics holds everything Monitor works out by itself. Add calculated metric opens a catalogue of ready-made functions. A calculation defined on the device type applies to every device of that type: one rule for a thousand pumps.
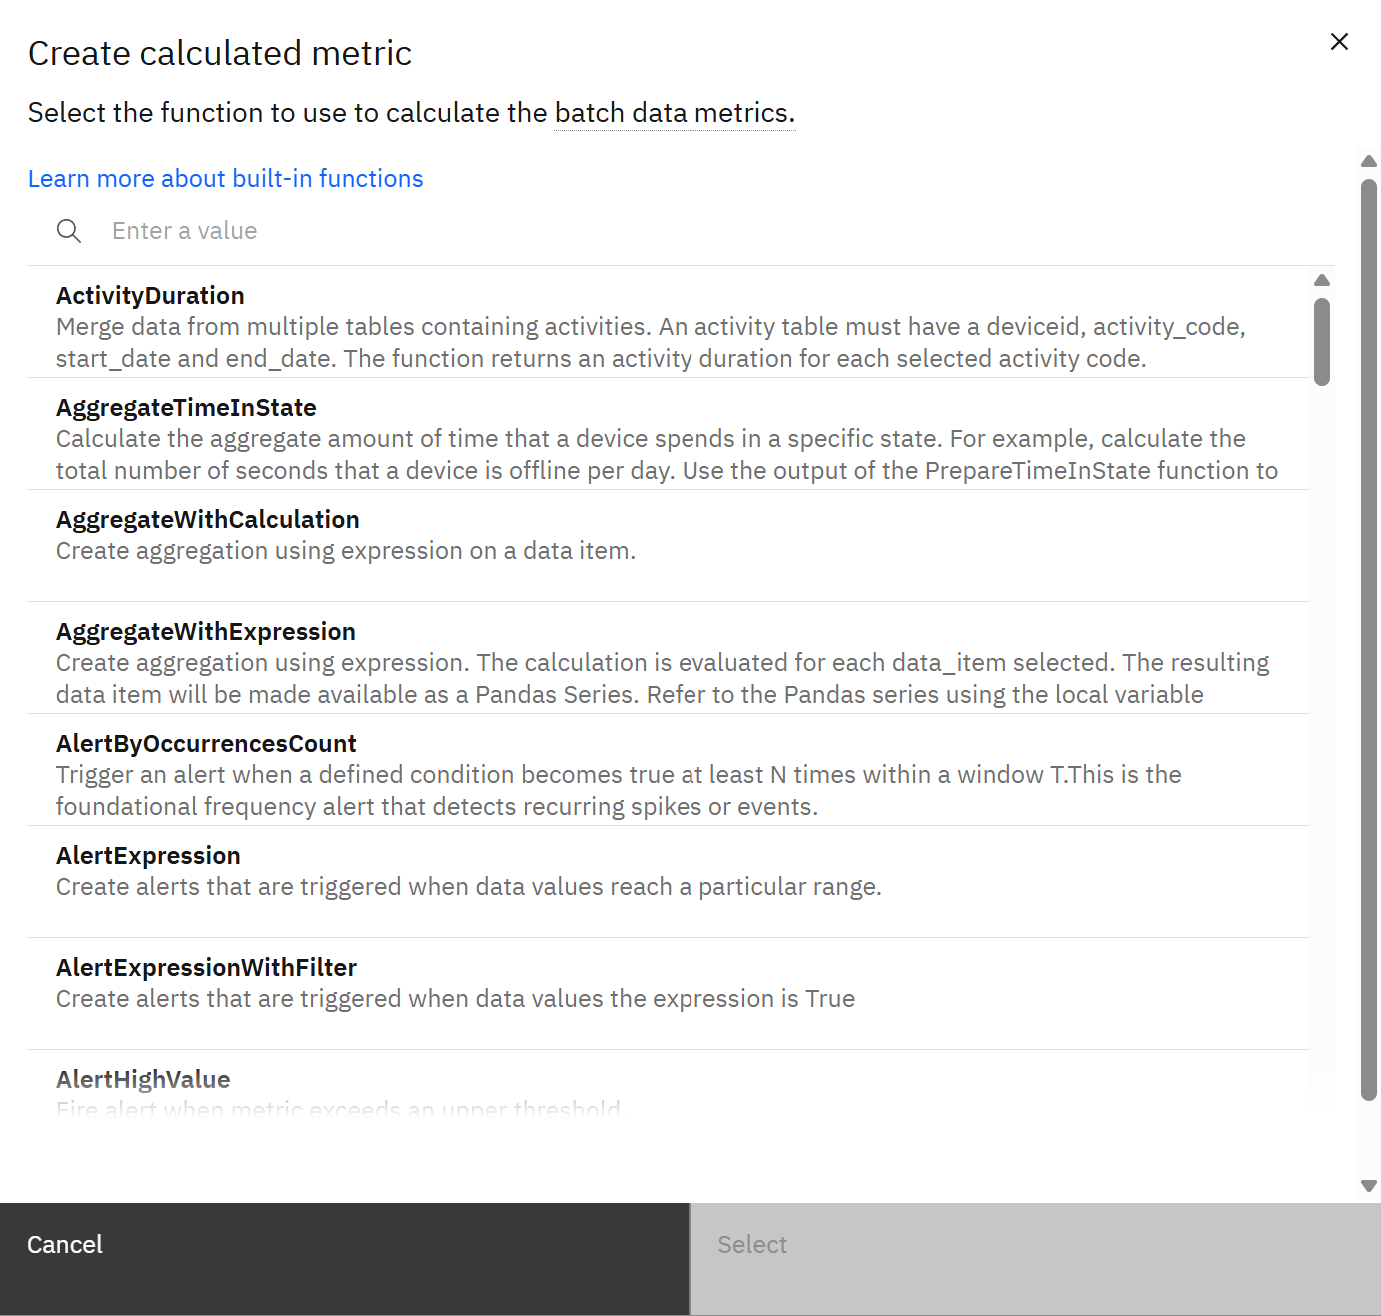
Alert create alerts; the others aggregate, compare and transform.For a first alert, AlertHighValue is enough: "fire alert when metric exceeds an upper threshold". It asks
three things on three screens:
| Screen | Question | For the pump |
|---|---|---|
| Scope | Which devices? | All devices of this type. |
| Input | Which metric, which limit, how serious? | vibration, upper threshold 3.5, severity High, status New. |
| Output | What is the alert called? | A name you will recognise in a list, such as vibration_high. |
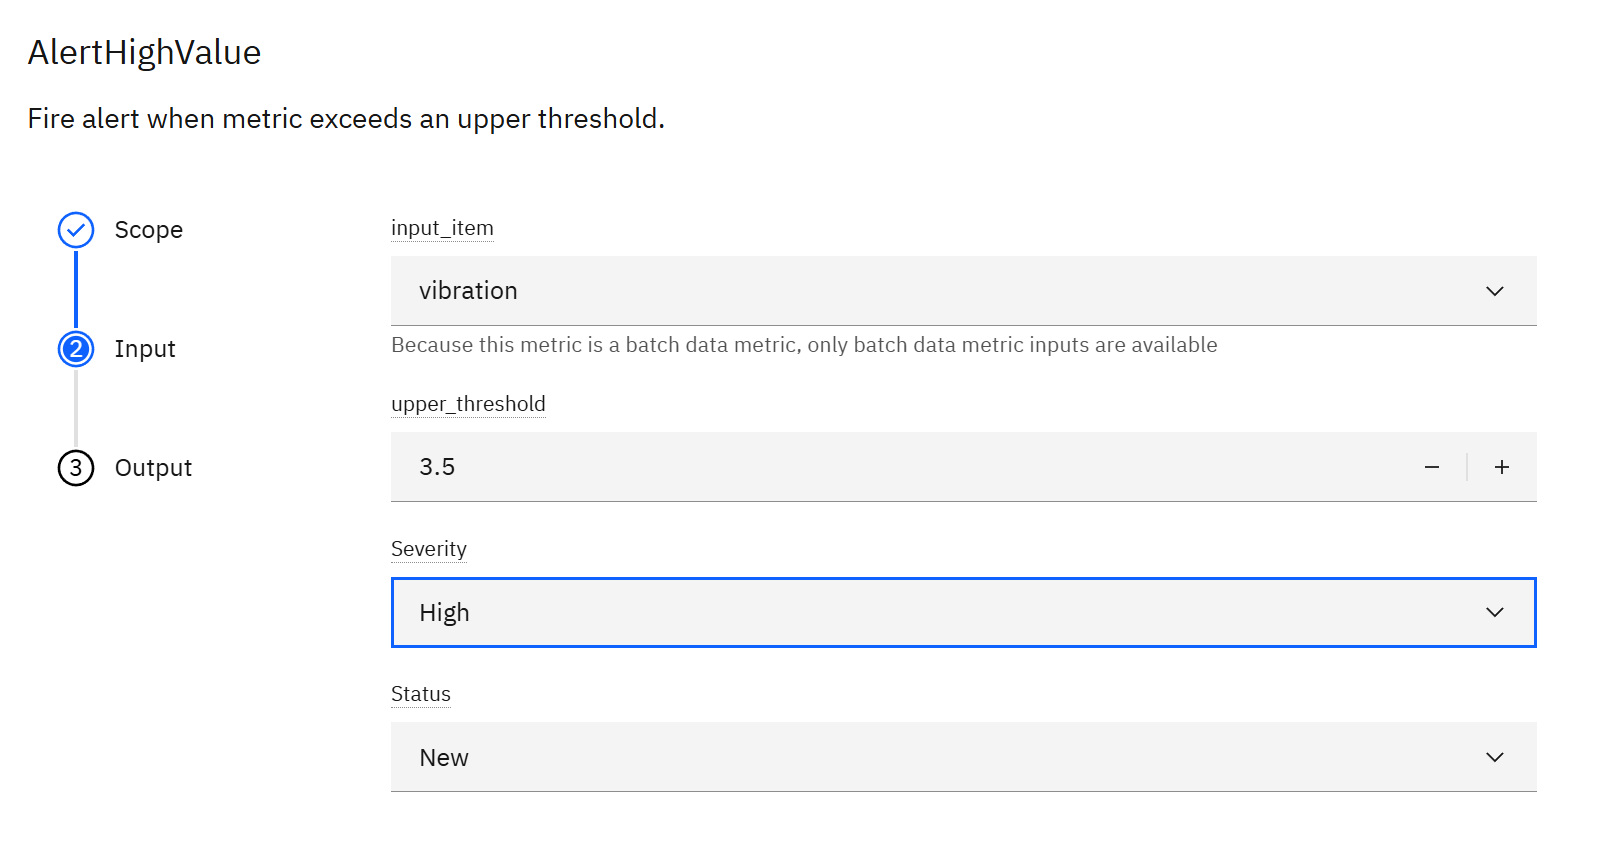
vibration, upper threshold 3.5, severity High.The dialog says it in small print: these are batch data metrics. Monitor calculates them on a schedule, every few minutes, not at the moment a reading arrives. For condition monitoring of rotating equipment that is fine: a bearing does not fail in five minutes. For a trip that must happen within a second, the protection belongs in the control system at the plant, not in an application in a data centre.
Step 3 of 3: from alert to work
Every device type gets a dashboard called Alerts without you building it. A few minutes after the rule was saved, the indicator at the top of the device type changed from "Analysis off" to "Analysis on", and the dashboard was no longer empty. Open it from Monitor data on the Monitor home page, then the device type.
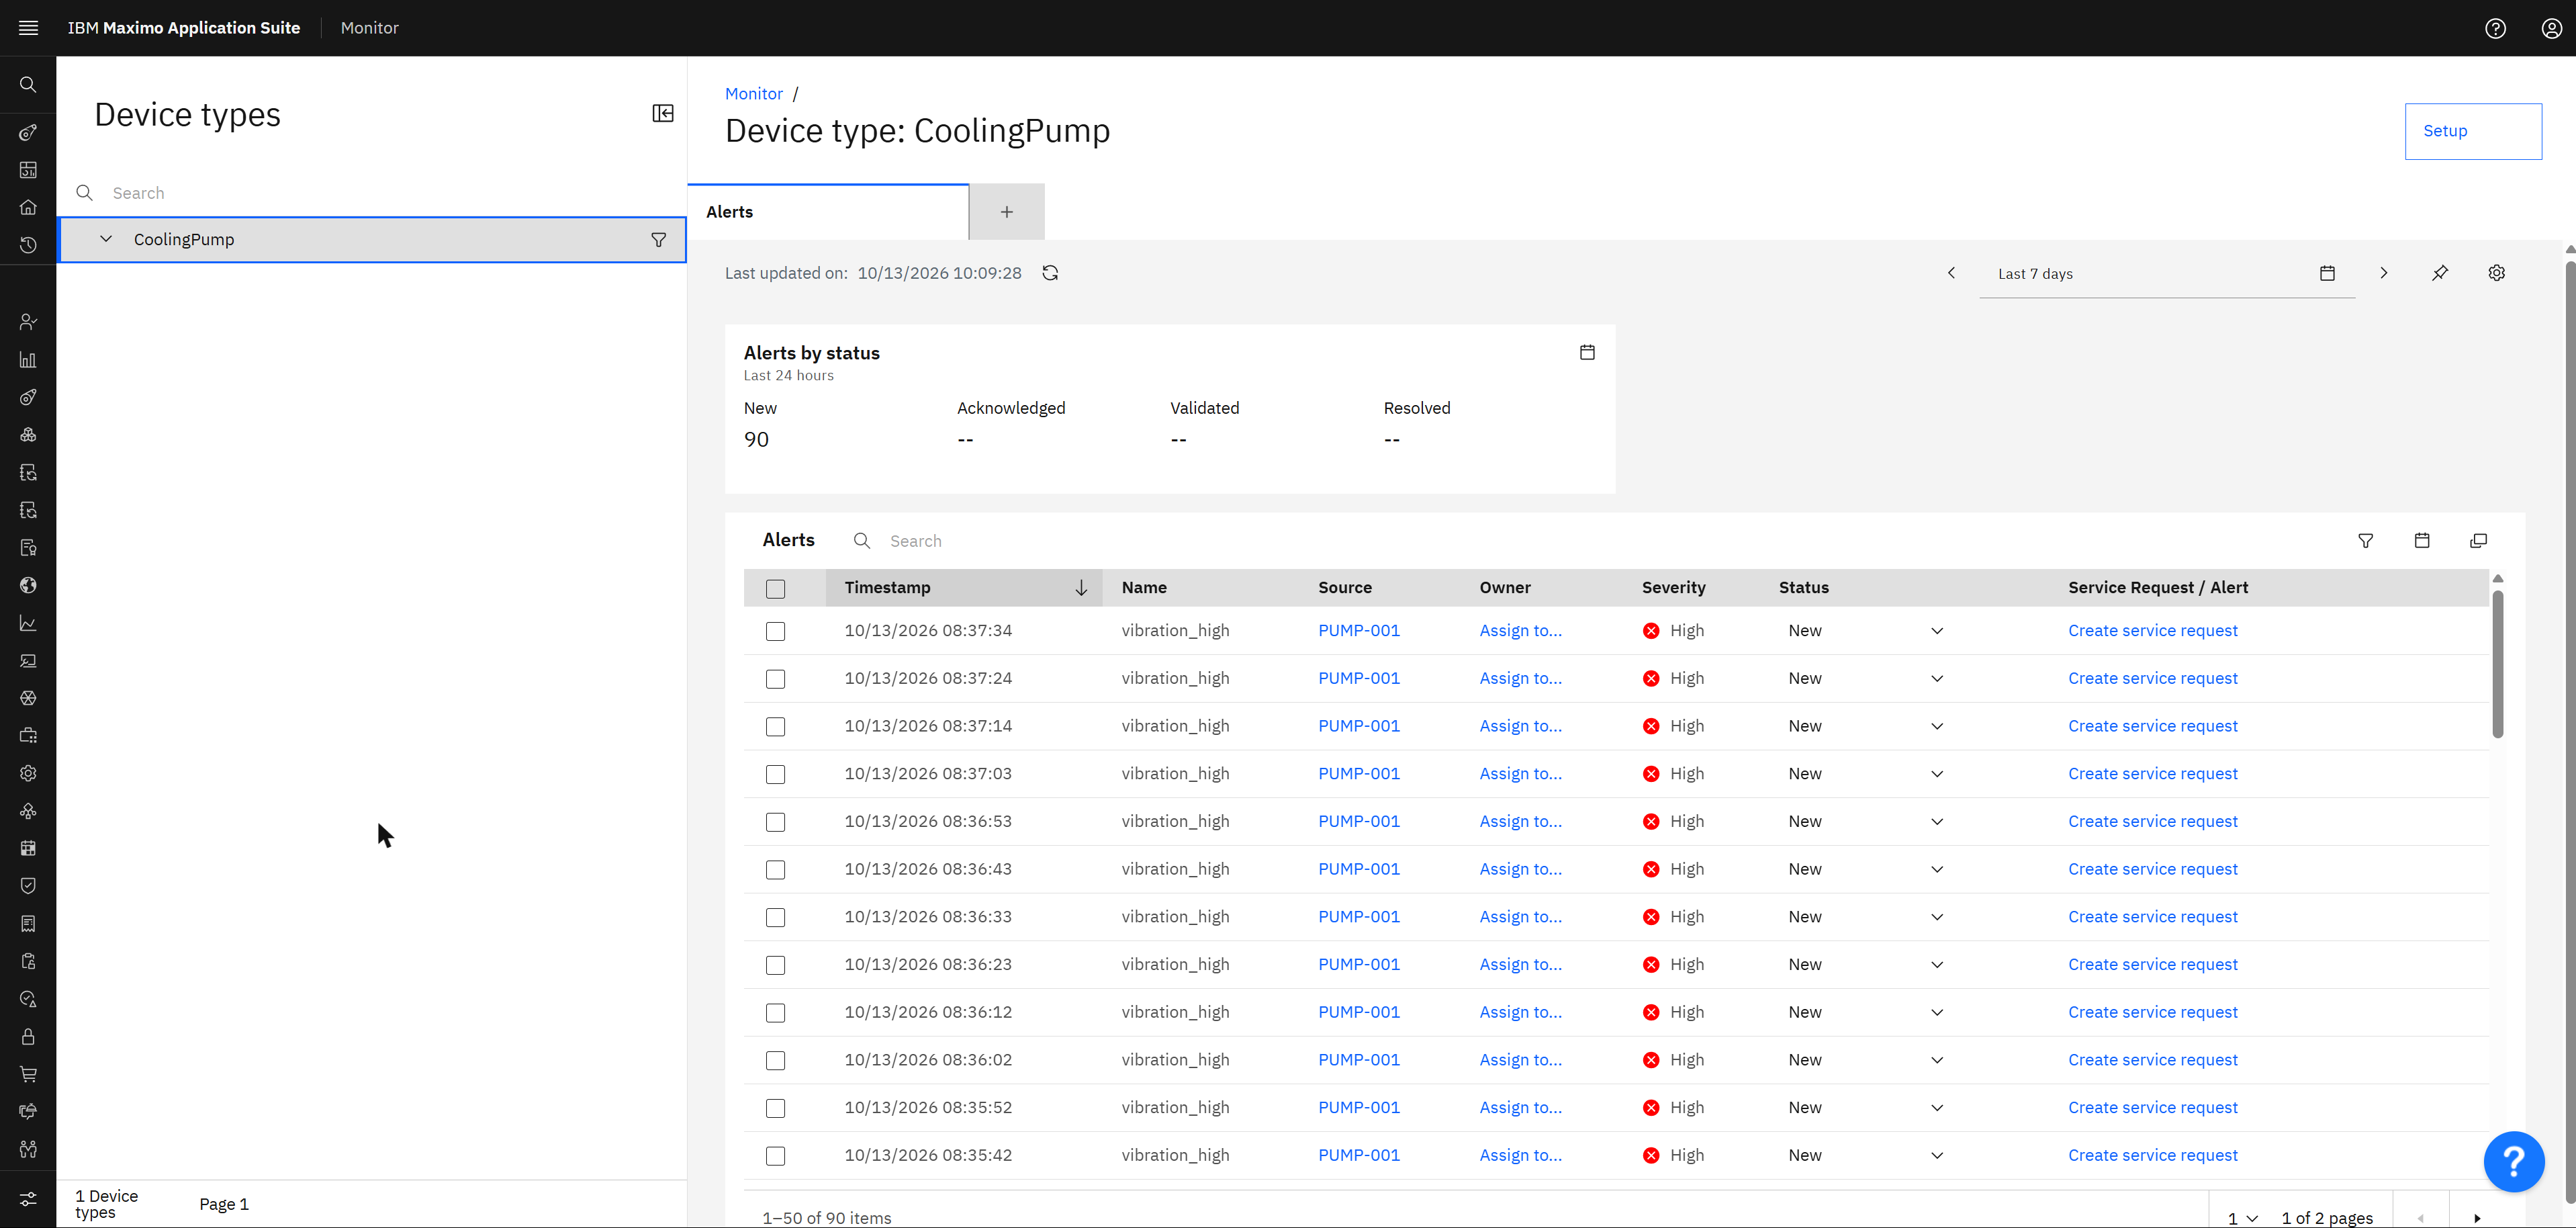
vibration_high, all from PUMP-001, all High, all New. Each row ends with a link: Create service request.Three things on this screen are worth a minute each.
- It found the past. The rule was created after the bearing episode was over. The first analysis run went back over the stored readings and raised the alerts with their original times, from about 08:22 to 08:37. Data that is stored can be judged again with a better rule; data that was never kept cannot.
- Ninety alerts for one problem. The simple function fires for every reading above the limit, and the pump
reported every ten seconds for a quarter of an hour. One failing bearing, ninety rows. This is the "alert noise" that
makes operators stop looking. In a real setup you would alert on an hourly maximum, or use a function that fires
when a condition has occurred several times within a window, such as
AlertByOccurrencesCountin the same catalogue. - The last column is the bridge to Manage. From the row, an operator sets an owner, changes the status from New to Acknowledged, Validated or Resolved, and with Create service request opens a record in Manage for the maintenance team.
That closes the loop this guide started with: a number left a device over MQTT, crossed Kafka, was stored and judged by Monitor, and can arrive in Manage as a piece of work for a person.
Bonus step: build your own dashboard
The Alerts dashboard is given to you. Everything else you compose yourself from cards, with no code. On the device type, next to the Alerts tab, click the + tab, type a title (here Pump health) and click Configure dashboard. The editor opens with an empty canvas on the left and a Gallery on the right.
| Card in the gallery | What it shows | Use it for |
|---|---|---|
| Value/KPI | One number, with a unit | "What is it right now?" |
| Time series line | One or more metrics over time | "How did it get here?" |
| Simple bar, Stacked bar | Values compared by category or time bucket | Comparing devices or periods |
| Data table | Rows of readings | Exact values, export |
| Alert table | Alerts with owner, severity and status | The operator's to-do list |
| Image | A picture with values placed on it | A pump drawing with live numbers |
| Third-party content | An embedded web page | A camera feed, a map |
Click a card in the gallery and it lands on the canvas. Then, in the right panel, give it a title, a size and a Data item: the list offers the four metrics defined earlier (Temperature, Discharge pressure, Bearing vibration, Flow rate). While you edit, the cards are drawn with made-up sample values; the banner at the top says so. Click Save and close and the same cards fill with the real readings.
The dashboard below has nine cards: four Value/KPI cards for "now", four Time series line cards for the trend, and one Alert table.
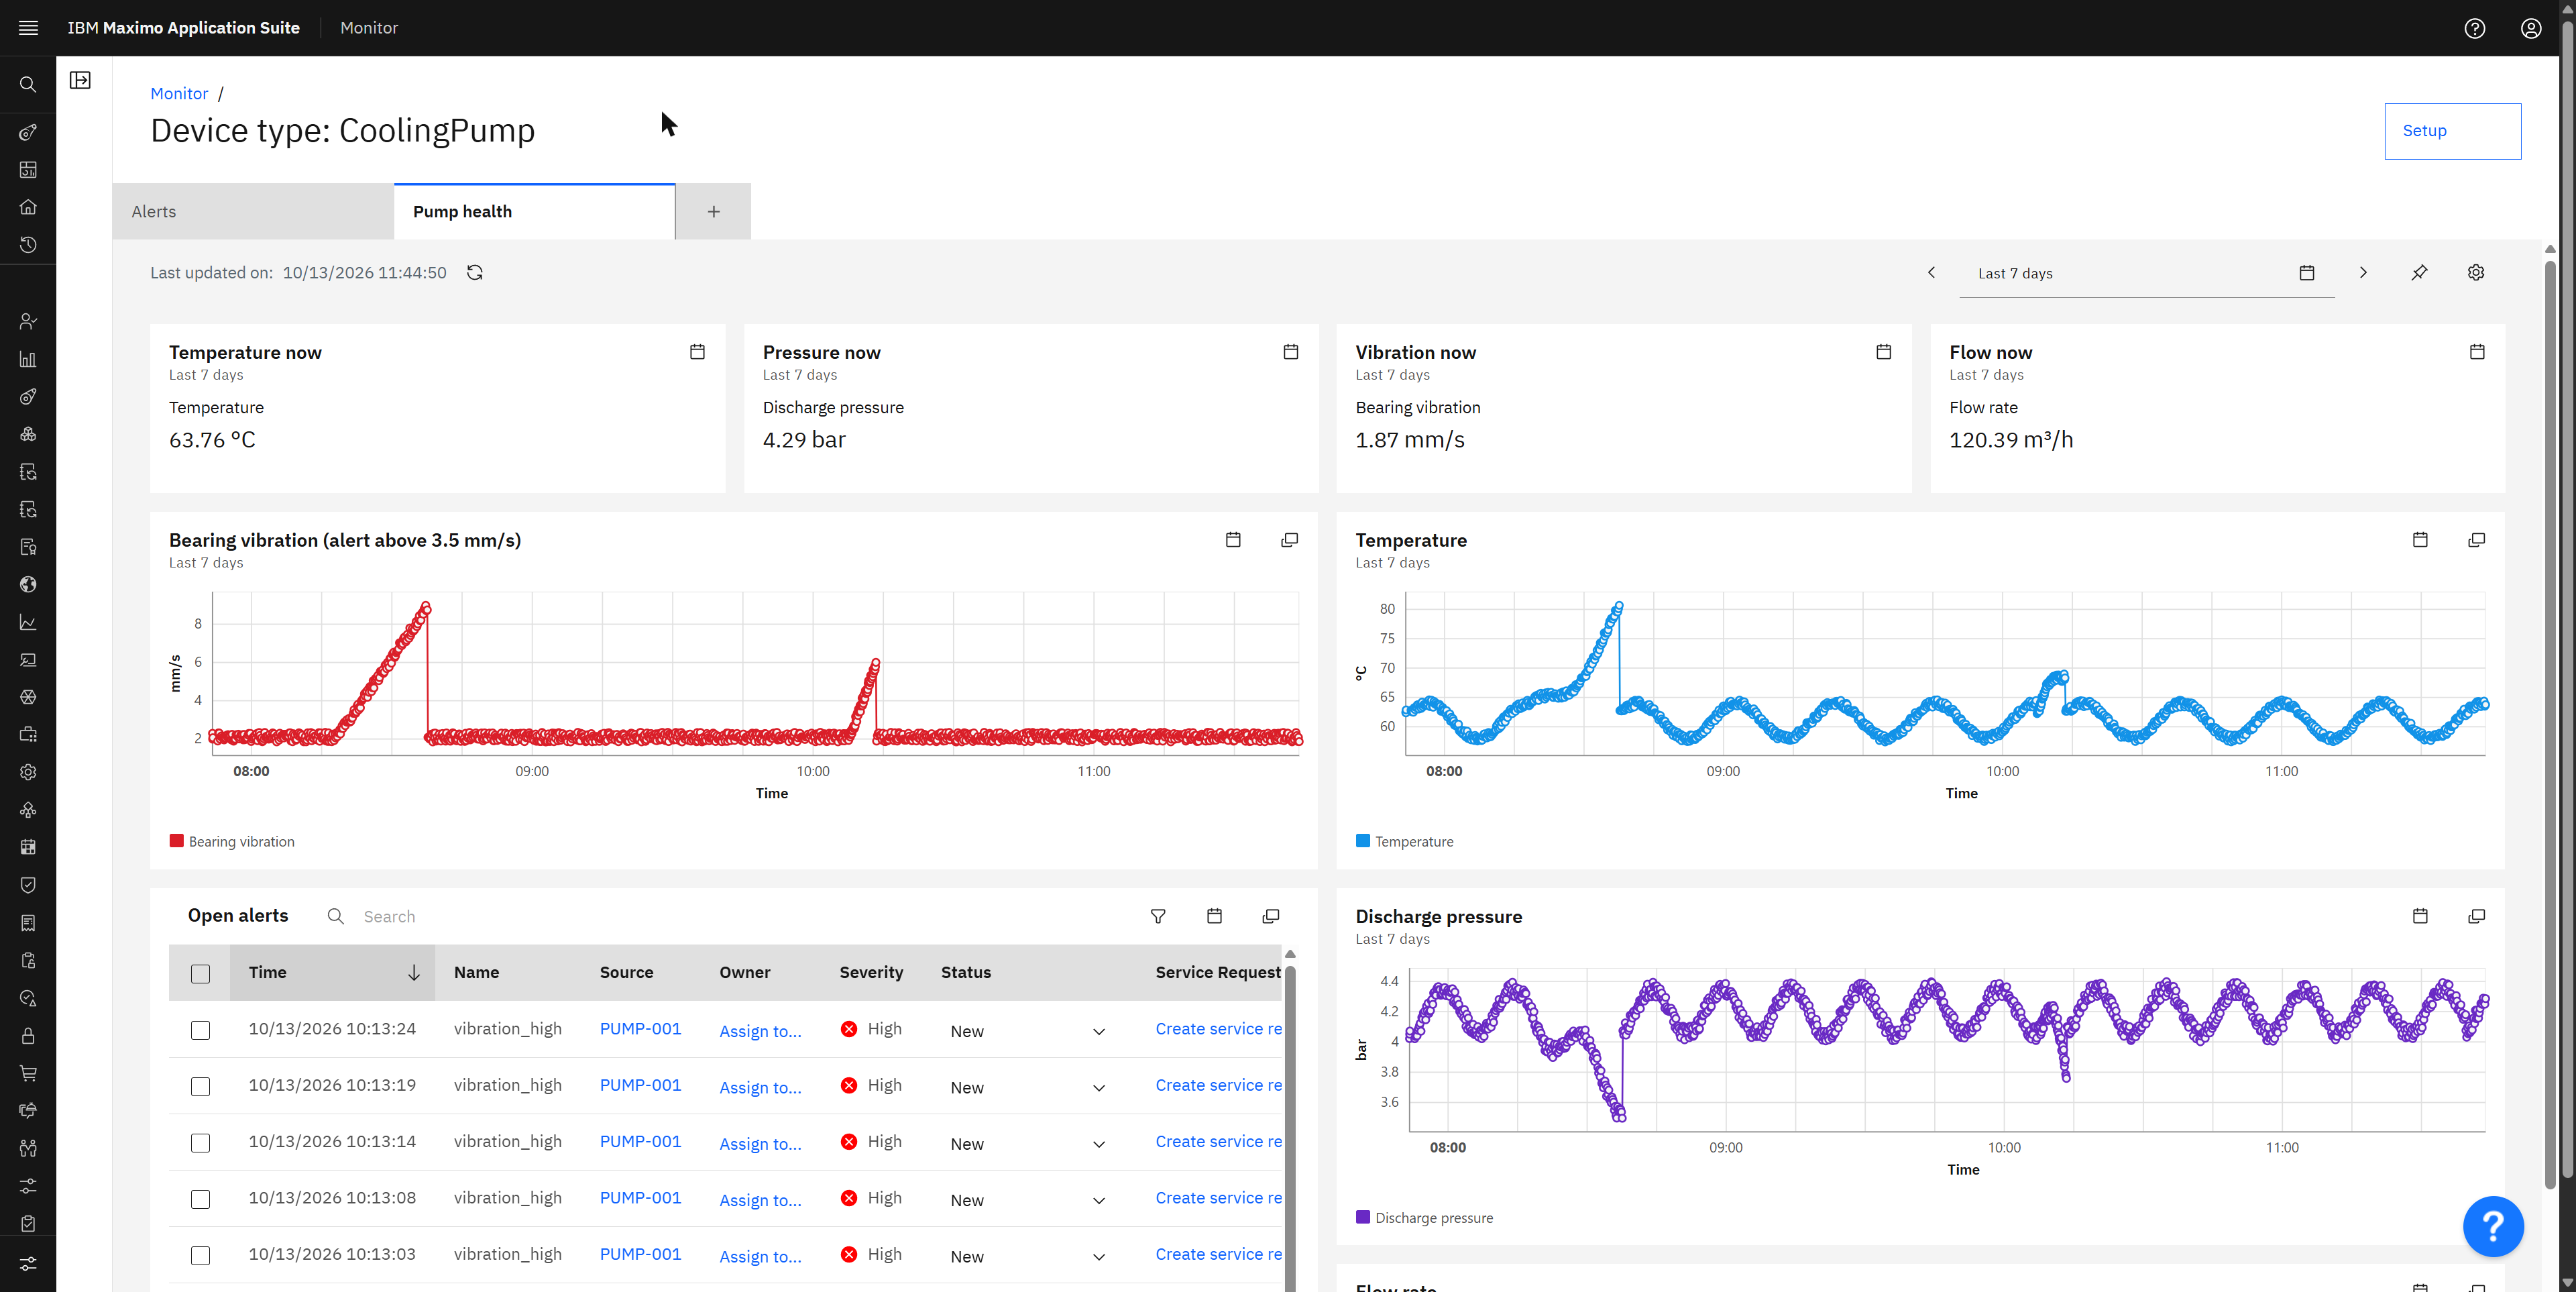
Now read it the way an operator would. The numbers in the top row are all normal, so nothing is wrong now. The charts tell what happened earlier:
- Vibration climbs from 2 to almost 9 mm/s shortly after 08:20 and drops back at once: the bearing episode from the exercise. A smaller second episode follows just after 10:00.
- Temperature rises to 80 °C in the same minutes, and pressure falls from 4.2 to 3.5 bar.
- The Open alerts table lists the
vibration_highrows that the rule raised for those minutes.
Three charts moving together in the same minutes is what turns "a high number" into a diagnosis. One reading above a limit can be a bad sensor. Vibration up, temperature up and pressure down at the same moment is a pump in trouble. That is the reason to put related metrics next to each other on one page.
In the editor, select a card and click Open JSON editor to see it. The buttons at the top of the editor export the whole dashboard to a file and import it again, which is how you copy a dashboard from a test system to production. This is the Temperature card:
JSON{
  "title": "Temperature now",
  "size": "SMALL",
  "type": "VALUE",
  "content": {
    "attributes": [ { "dataSourceId": "temperature_1", "label": "Temperature", "unit": "°C", "precision": 2 } ]
  },
  "dataSource": {
    "attributes": [ { "id": "temperature_1", "attribute": "temperature", "aggregator": "last", "eventName": "status" } ]
  }
}
Read it from the bottom: take the attribute temperature from the event status, keep the
last value in the selected time range, and show it with two decimals and the unit. Change
last to max or mean and the same card answers a different question.
Going further: let Monitor find what "not normal" looks like
The alert in step 2 needed a number from you: 3.5 mm/s. Somebody has to know that number, for every metric of every kind of equipment. Anomaly detection turns the question around. You do not say what is too high. A function looks at the recent behaviour of the signal and gives every reading a score for how unlike the rest it is. You then alert on the score.
These functions sit in the same catalogue as AlertHighValue. The catalogue is larger than it looks
in the dialog; IBM lists and describes every entry on one page,
Built-in functions. The families worth recognising:
| Family | Examples | What they are for |
|---|---|---|
| Alert | AlertHighValue, AlertLowValue, AlertOutOfRange, AlertExpression, AlertByOccurrencesCount, NoDataAlert | Raise an alert from a rule you write. The last two answer "it happened N times in a window" and "the device went silent". |
| Anomaly score, unsupervised | KMeansAnomalyScore, GeneralizedAnomalyScore, FFTbasedGeneralizedAnomalyScore, SpectralAnomalyScore, SaliencybasedGeneralizedAnomalyScore, MatrixProfileAnomalyScore, NoDataAnomalyScore | Score how unusual each stretch of a signal is, with no examples of failure needed. |
| Anomaly, supervised | GBMRegressor | Learn to predict one metric from others; a large gap between prediction and reality is the anomaly. |
| Anomaly simulator | AnomalyGeneratorExtremeValue, AnomalyGeneratorFlatline, AnomalyGeneratorNoData | Inject spikes, flat lines and gaps into a signal so you can test a detector before a real failure happens. |
| Summarise | Mean, Maximum, Minimum, Count, StandardDeviation | Roll readings up per hour or day. |
| Transform and filter | PythonExpression, IfThenElse, Coalesce, DateDifference | Derive a new value from existing ones, for example power from voltage and current. |
Add an anomaly score to the pump
On the device type, open Setup, the tab Calculated metrics, and click Add calculated metric. Type "Anomaly" in the filter.
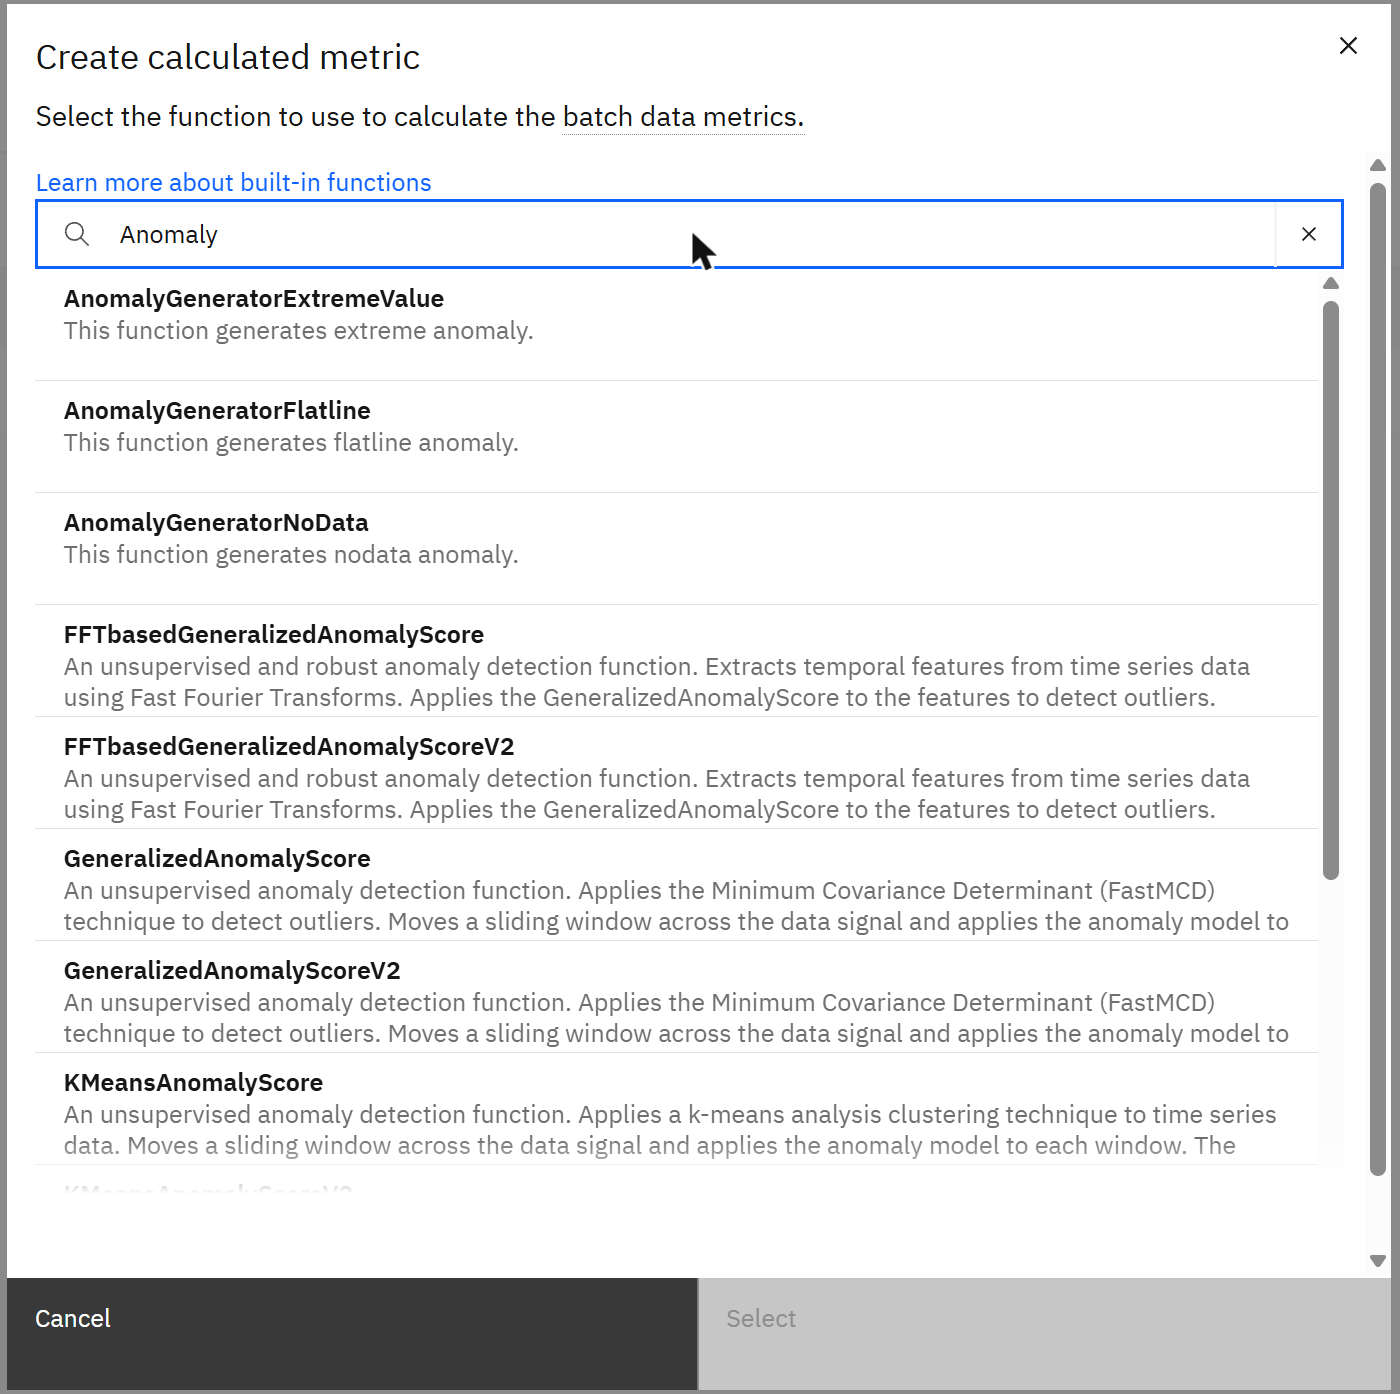
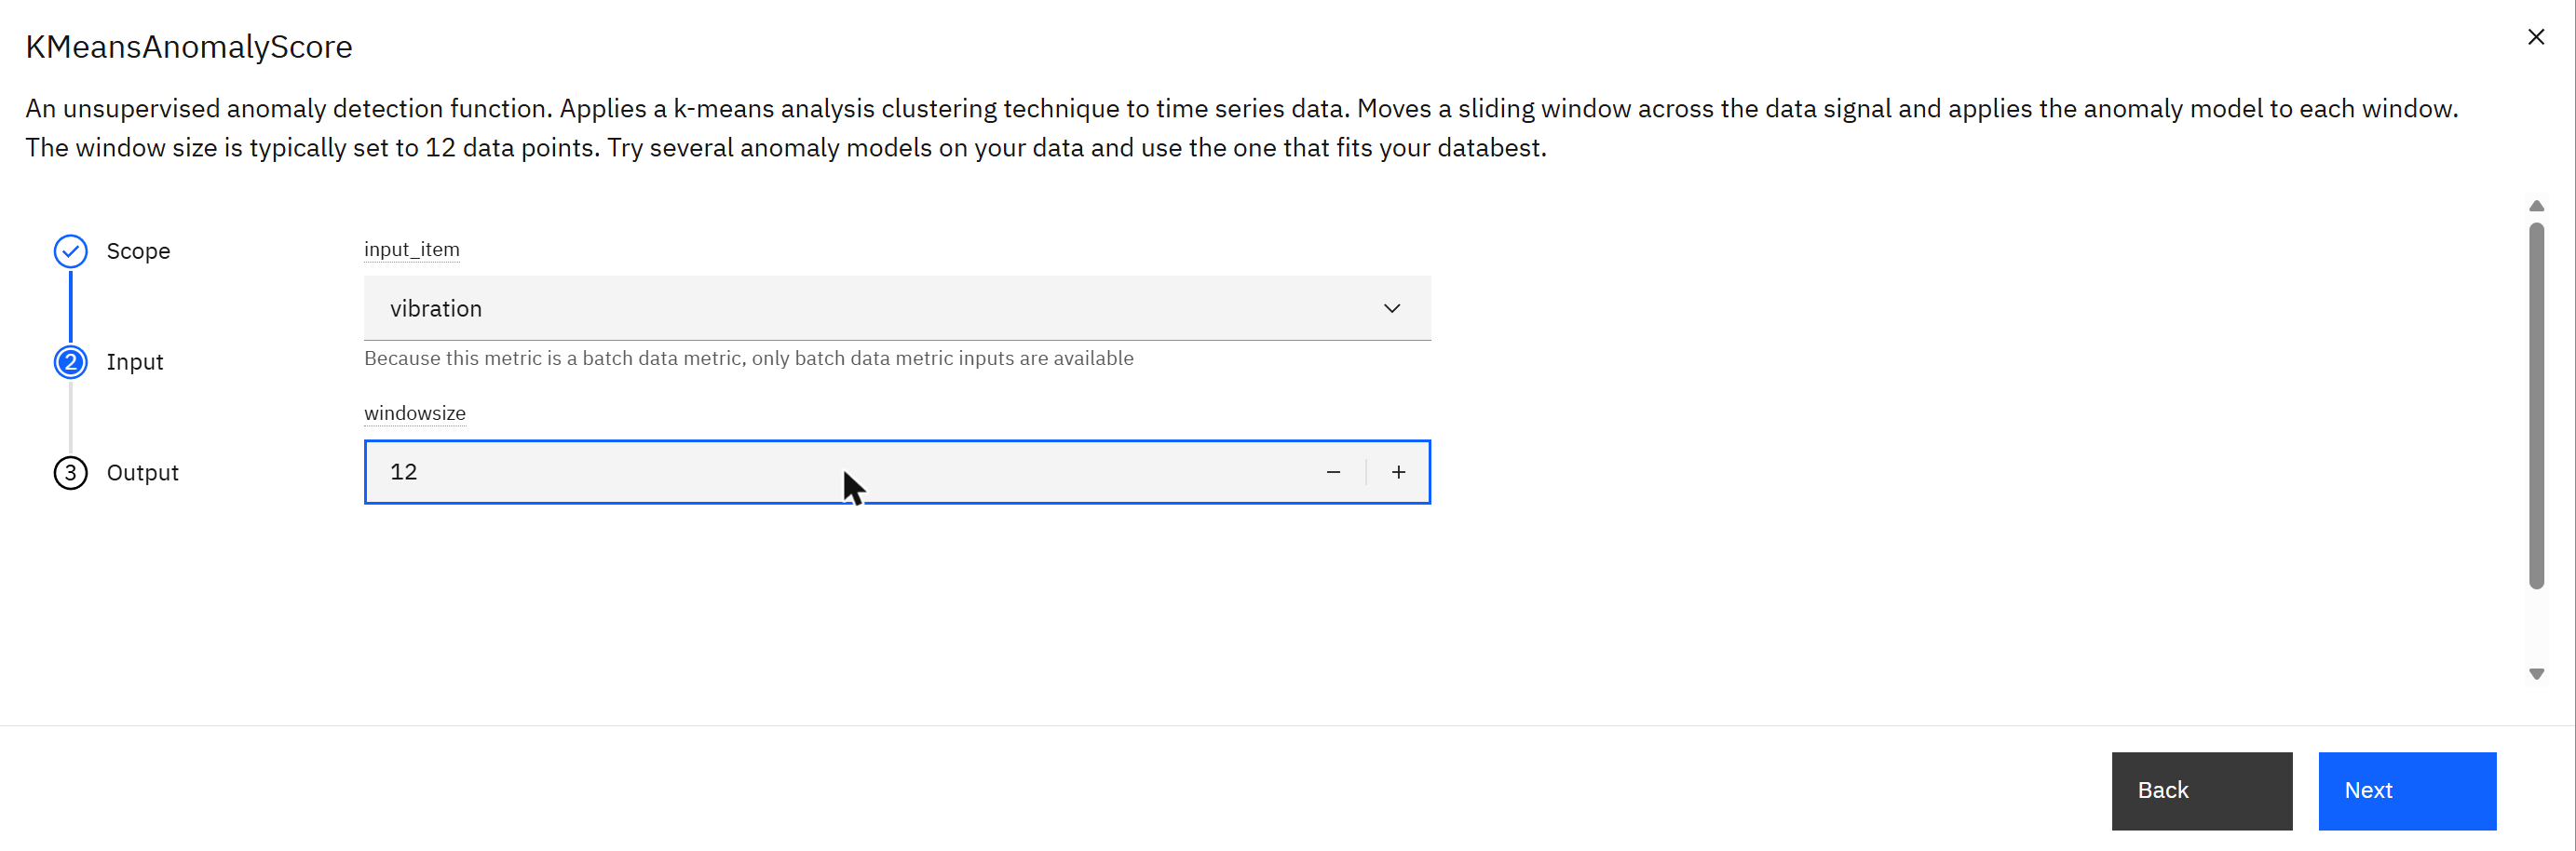
Choose KMeansAnomalyScore and Select. The wizard has the same three steps as the alert:
- Scope: all devices of this type.
- Input:
input_itemis the metric to watch, herevibration.windowsizeis how many consecutive readings are judged together; the dialog itself says it "is typically set to 12 data points". - Output: a name for the new data item, here
vibration_anomaly, with Auto schedule on.
The new item appears in the list of calculated metrics with category Transformer: it creates data, not
alerts. Because it is a data item like any other, it can go on a dashboard. In the dashboard editor a Time series
line card offers vibration_anomaly in its Data item list, next to the four raw metrics.
The first result was a flat line, and why
The card showed a perfectly flat score of zero, even while a new bearing episode was being sent. A flat zero is
not "everything is normal". It was the function failing quietly. Monitor runs its calculations as a short-lived pod
every five minutes in the namespace mas-instdb2-monitor, and that pod's log says what happened:
Shell$ oc logs -n mas-instdb2-monitor <latest wsp.g1... pod> | grep -i kmeans
KMeans, Entity: PUMP-001, Input: vibration, Windowsize: 12, Output: ['vibration_anomaly'], Overlap: 6, Inputsize: 30
KMeans failed with Could not form valid cluster separation. Please change n_clusters or change clustering method
Read the end of the first line: Inputsize: 30. Each run hands the function only the readings that
arrived since the previous run. The pump was reporting every ten seconds, so a five-minute run contained about thirty
values. With a window of 12 that is a handful of windows, too few to tell normal from unusual, and the function
gives up and writes zero.
Turning Auto schedule off shows
two fields, Starting at and Executing every. Changing them here did not change how much data a run
receives: the log still said Inputsize: 30. What fixed it was the data itself. With the pump reporting
once per second, the next runs logged Inputsize: 249 and Inputsize: 243, the failure line
disappeared, and the score came alive. IBM's documentation makes the same point in one sentence: configure the
schedule according to how often the input metric reports. A signal that reports
rarely needs a longer batch than five minutes before a detector like this one has anything to work with.
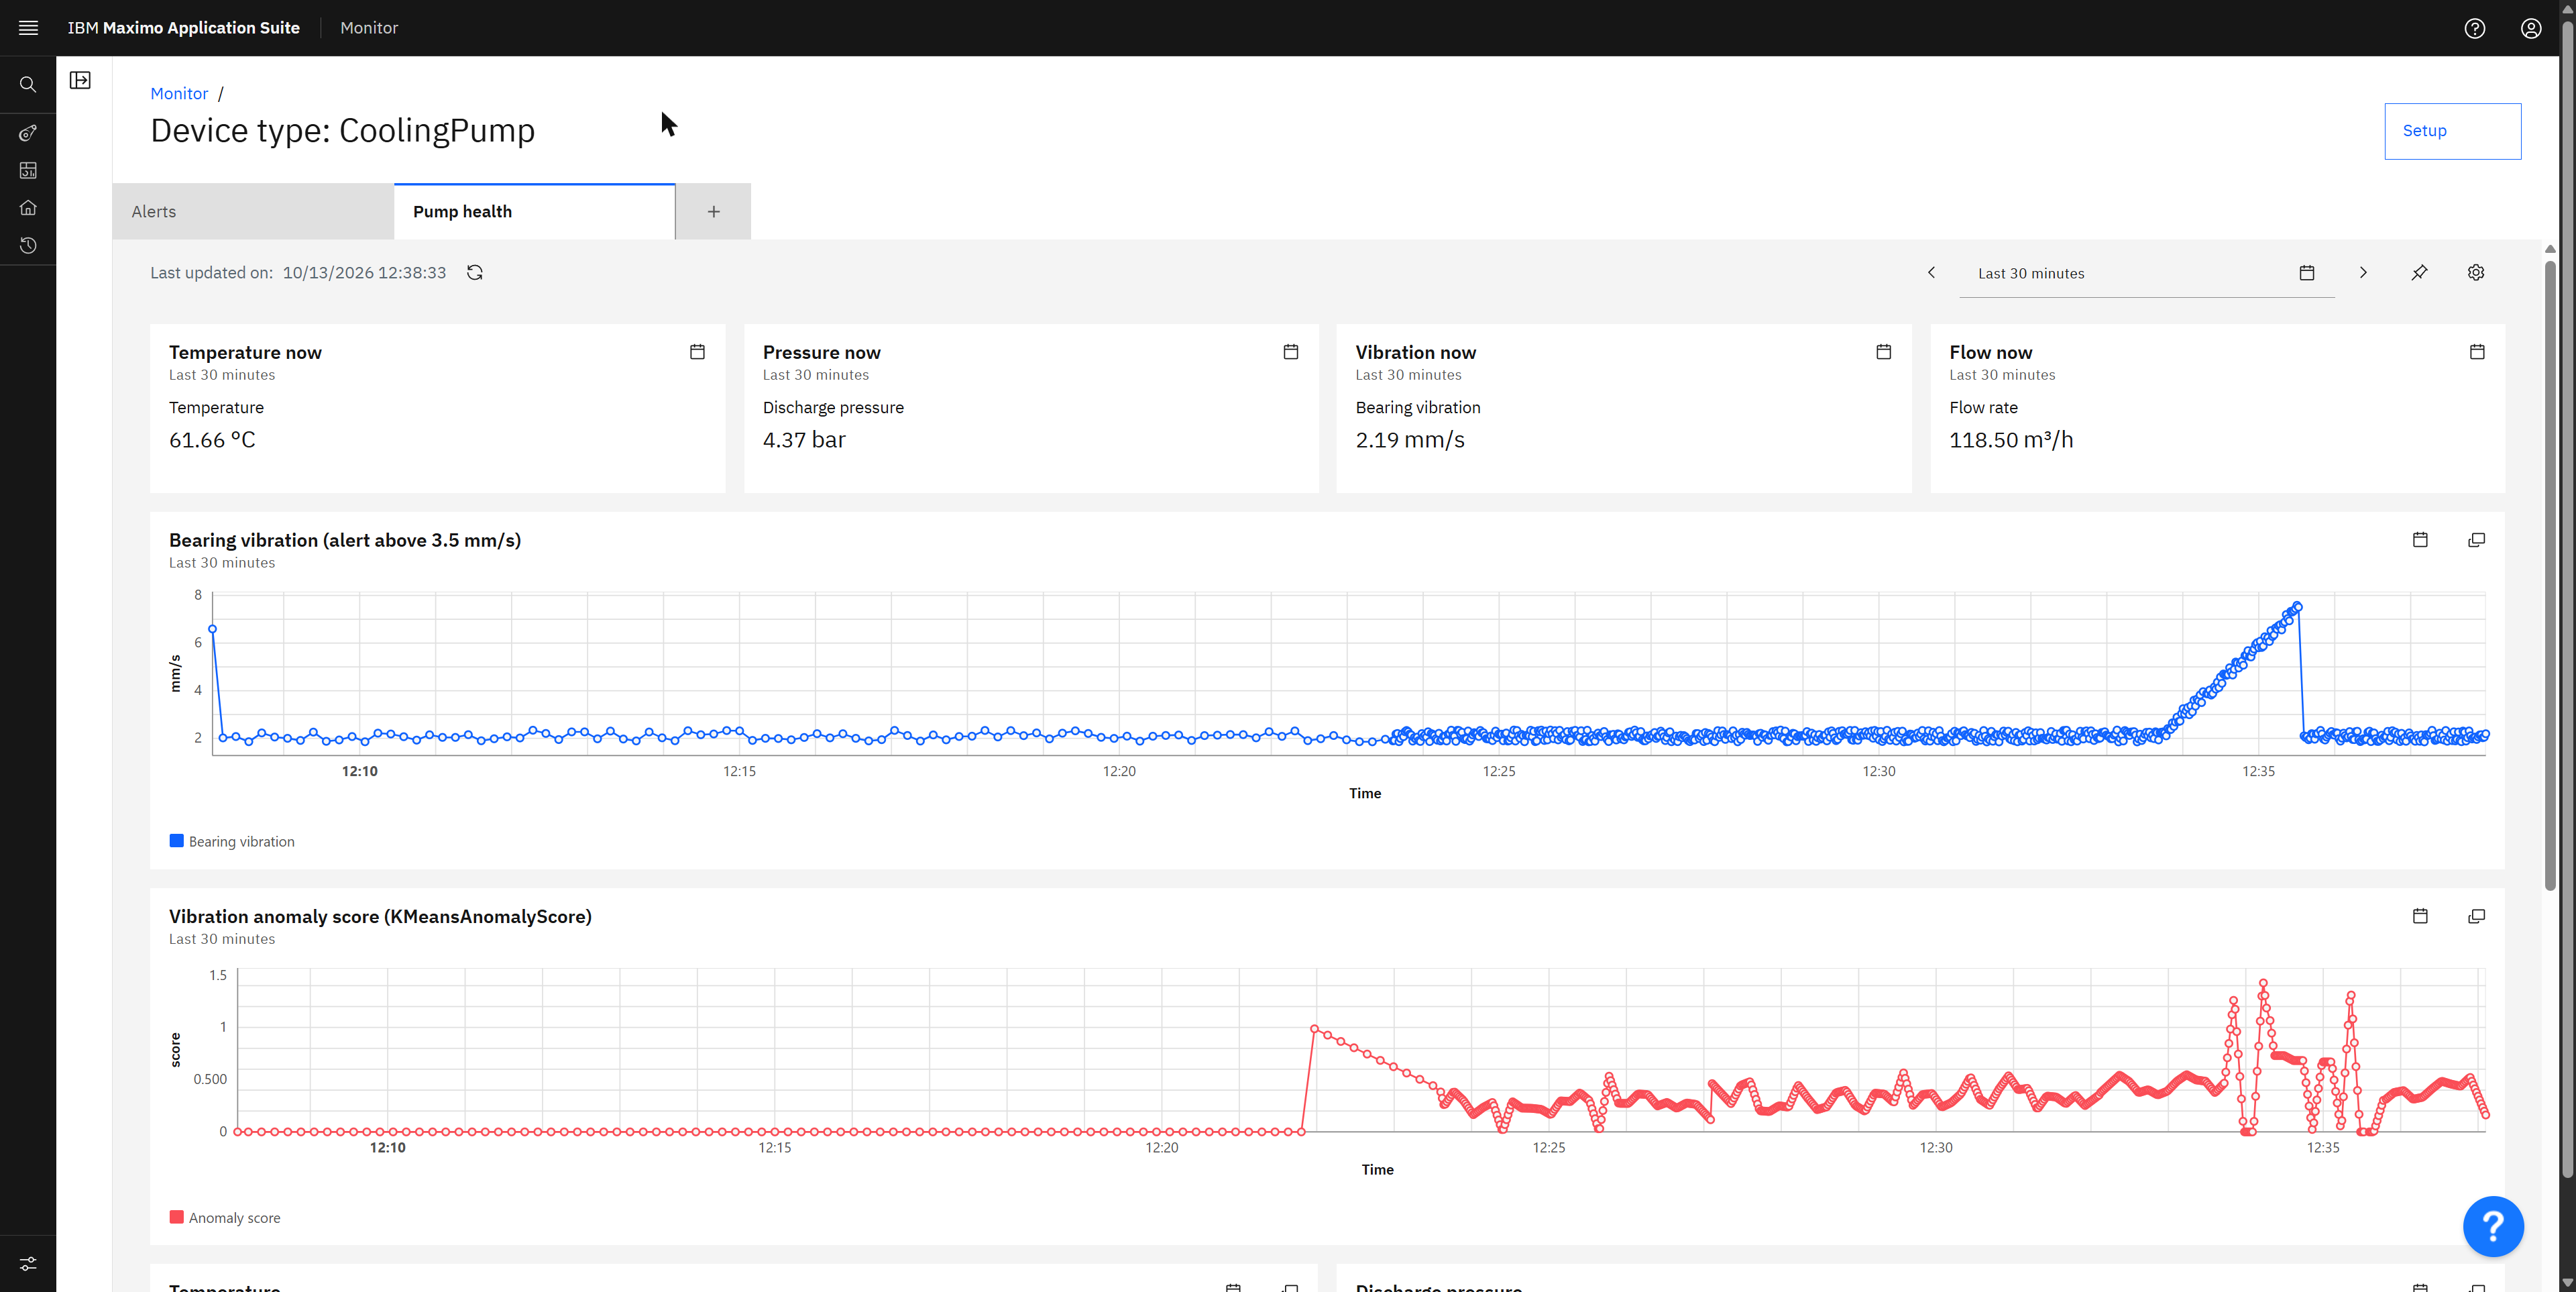
Now read the two charts together.
- The score has no unit. It is not mm/s. It only means "more unusual" when higher. Here normal running sits between 0 and about 0.5, and the fault reaches about 1.4, roughly three times the baseline.
- It reacts to shape, not to level. Nobody told the function about 3.5 mm/s. It reacted because a steady climb looks nothing like the usual jitter around 2.
- It is noisy. The baseline never rests, and during the episode there are three separate spikes with dips
between them. One reading of the score above a limit is weak evidence. Several within a few minutes is strong
evidence, which is exactly what
AlertByOccurrencesCountis for. - The first point of the baseline, near 1.0 at 12:22, is a start-up effect of the first run that had enough data. Expect that after any gap, and do not alert on the first minutes.
Which detector, and what about supervised?
The dialog's own advice is honest: "Try several anomaly models on your data and use the one that fits." IBM's page Unsupervised anomaly detectors explains each one. A short guide:
| Detector | Idea in one line | Reach for it when |
|---|---|---|
KMeansAnomalyScore | Groups windows of the signal into clusters; a window far from every cluster scores high. | A general first try. |
GeneralizedAnomalyScore | Measures how far a window lies from the centre of normal behaviour. | A second opinion on the same signal. |
FFTbasedGeneralizedAnomalyScore | First turns each window into its frequencies, then scores. | Signals with a rhythm, such as rotating equipment. |
SpectralAnomalyScore | Spectral analysis; the output is a z-score, and IBM's guidance is that above 3 is an anomaly. | You want a score with a ready-made meaning. |
SpectralAnomalyScoreExt | Adds a second score for low activity. | Flat lines: a sensor stuck on one value. |
NoDataAnomalyScore | Scores gaps; a longer gap scores higher. | Devices that go quiet. |
MatrixProfileAnomalyScore | Compares every stretch with every other; one that resembles nothing else scores high. | Rare, oddly shaped events. |
All of these are unsupervised: they need no examples of failure, only data. The other kind is
supervised. IBM documents one, GBMRegressor, on the page
Supervised anomaly detectors. You name a target metric and the
features that should explain it, for example predict discharge pressure from flow and temperature. The function
trains a model on real data and then predicts the target. It has no alert of its own; you add one that fires when
prediction and reality differ by more than a threshold. Use it when you understand which metrics drive which, and
retrain it when the equipment or its firmware changes.
| Fixed threshold | Unsupervised score | Supervised prediction | |
|---|---|---|---|
| You must provide | The limit. | A metric and a window size. | A target, its features, and a period of good data to learn from. |
| Catches | Values beyond the limit. | Behaviour unlike the recent past, even inside the limit. | A metric that stops agreeing with the ones that normally explain it. |
| Misses | Trouble that stays under the limit. | A fault that has become the new normal. | Anything the features cannot explain. |
| Explains itself | Fully. | Poorly: a score, not a reason. | Partly: predicted versus actual. |
A score on a chart helps a person who is looking. To make it work at night, put an ordinary
AlertHighValue on the score. For the threshold IBM suggests a method instead of a number: let the
detector run for about a week, assume roughly one reading in a thousand is truly unusual, average the top 0.1% of the
scores, and start there. Then tune with experience. Thresholds and anomaly scores are partners: keep the hard limit
for the cases you know, and add the score for the ones you did not think of.
Why a business pays for this
Juniors are often asked to "connect the sensors" without being told why. These are the reasons a plant manager cares, in the order they usually appear:
| Value | What changes on the ground |
|---|---|
| Fewer rounds | Technicians stop walking the plant to read gauges that are fine. They go where a reading says something is wrong. |
| Earlier warning | A slow drift, like the vibration above, is visible days or weeks before the failure. The repair becomes planned work instead of a breakdown, with the part ordered and the downtime chosen. |
| One rule, every asset | An engineer's knowledge ("this pump type should not exceed 3.5 mm/s") is written once and applied to every pump of that type, on every site, around the clock. |
| Evidence | The history answers "when did this start?" and "did the last repair help?", which maintenance records alone cannot. |
| The base for more | Health scores and failure prediction in the suite are calculated from this same data. Without trustworthy readings there is nothing to score or predict. |
| Next to the maintenance system | The alert lands in Manage against the right asset, where the work order, the spare parts and the history already are. No second system to keep in step. |
Rarely in the technology. Usually in three plain things: nobody decided which asset each signal belongs to; the limits were copied from a manual instead of agreed with the people who run the equipment; and alerts were switched on for everything, so within a week nobody looked at them. Start with one asset class, five signals and three alerts that somebody has promised to act on.
Part 7The Maximo Integration Framework
Now the other lane: business records. Everything here lives in Manage, under the Integration module. The framework has seven building blocks. Learn them as a chain, because that is how a message travels.
| Block | What it is | Example |
|---|---|---|
| Object structure | The shape of the data: one main business object and its children, as one document. It is the foundation of everything else, including the REST API. | MXASSET: an asset with its meters and specifications. |
| Publish channel | The outbound pipe for one object structure. It can listen for changes ("event listener") and send a message every time a record is saved. | MXASSETInterface: sends an asset whenever it changes. |
| Enterprise service | The inbound pipe for one object structure. It receives a message and creates or updates records, with the same validations as the screen. | MXASSETInterface: receives an asset from outside. |
| Invocation channel | A call that Manage makes to another system and waits for the answer. No queue. | Ask a GIS for coordinates while the user waits. |
| External system | The partner. It groups the channels and services that this partner uses, names the queues, and can be switched on and off as a whole. | ERP: three publish channels, five enterprise services. |
| End point and handler | Where an outbound message is delivered and by which technology: HTTP, web service, file, database table, JMS, Kafka, a script. | An HTTP end point with the URL of the partner's API. |
| Queue | The waiting room between Manage and the outside. It makes the integration asynchronous: the user saves and moves on, the delivery happens afterwards and is retried if the partner is down. | sqout, sqin, cqin. |
Sequential or continuous: the question every interviewer asks
Sequential queue (sqin, sqout) | Continuous queue (cqin) | |
|---|---|---|
| Order | Strict. First in, first out. | None. Several messages are processed at the same time. |
| Who reads it | A cron task, JMSQSEQCONSUMER, one message at a time. | Message-driven beans in the application server, several in parallel. |
| When a message fails | The queue stops at that message until someone fixes or removes it. Nothing overtakes. | The message goes to the error queue (cqinerr) and the others continue. |
| Use it for | Data where order matters: a status change must not arrive before the record it belongs to. | Volume: thousands of independent records, where speed matters more than order. |
There is also a path with no queue at all: the REST API on object structures
(/maximo/api/os/…). The caller waits, gets the answer immediately, and handles errors itself. New
integrations often start there. Queues earn their place when the caller must not wait, when the partner may be offline,
or when a failed message must be kept and replayed.
Part 8Switching on JMS in a containerised Manage
This is the part that surprises people who learned Maximo 7.6. There, an administrator created the queues in WebSphere. In Maximo Application Suite, Manage runs as containers that an operator builds and replaces, so a change made inside a running server is gone at the next restart. The queues must be declared to the operator.
And out of the box, they are not there. Open Integration > External Systems and the action Add/Modify Queues: the list shows nine queues, which looks complete. But these are only records in the Maximo database, each holding a JNDI name. On the system used here, nothing stood behind those names. The server configuration had the JMS client feature only, and its one JMS-related file was a commented-out sample:
Shell$ oc exec -n mas-instdb2-manage <manage-pod> -- grep -n -i jms /config/server.xml
10:      <feature>wasJmsClient-2.0</feature>
16:      <!--feature>wmqJmsClient-2.0</feature>
17:      <feature>jmsMdb-3.2</feature-->
If you enable a publish channel on a system in this state, the save works and the message goes nowhere, or the user gets an error about a queue that cannot be found. Always check that a messaging server exists before promising an interface.
Where the setting lives: the Manage workspace resource
Manage is described by a custom resource of kind ManageWorkspace, in the project
mas-<instance>-manage. The suite's administration pages edit this same resource: Administration >
Workspace > Manage > Actions > Update configuration > Server bundles. Whichever way you go in, four
pieces under spec.settings.deployment make a working JMS setup. None of them is enough alone.
| Piece | What it does | What you see if it is missing |
|---|---|---|
A server bundle of type standalonejms | Creates the JMS server: a separate pod running WebSphere Liberty with the messaging feature and the standard queues. | No messaging server at all. |
A persistent volume mounted at /jmsstore | Gives the JMS server a disk that survives restarts. /jmsstore is where its message store is written. | Everything works, and every queued message is lost when the pod restarts. |
| Additional server configuration on the Manage bundle | A piece of Liberty XML that tells the Manage server where the JMS server is, which queue each JNDI name means, and which queues its message beans consume. | The JMS server runs, and Manage cannot find a single queue. |
defaultJMS: true | Makes the image build use the deployment descriptor in which the message beans for the continuous queues are switched on. | Sequential queues work; continuous queues fill up and nobody reads them. |
Step 1. The client configuration. Save this as server-custom.xml. Only one value is specific to
your system: the address of the JMS server, which is the name of its OpenShift service,
<instance>-<workspace>-<bundle name>.mas-<instance>-manage.svc, on port 7276.
XML<?xml version="1.0" encoding="UTF-8"?>
<server description="Manage all bundle: client of the JMS server bundle">
  <featureManager>
    <feature>jndi-1.0</feature>
    <feature>wasJmsClient-2.0</feature>
    <feature>jmsMdb-3.2</feature>
    <feature>mdb-3.2</feature>
  </featureManager>

  <!-- one connection factory for all MIF queues, pointing at the JMS server pod through its service -->
  <jmsQueueConnectionFactory jndiName="jms/maximo/int/cf/intcf" connectionManagerRef="mifjmsconfact">
    <properties.wasJms remoteServerAddress="instdb2-wsp-jms.mas-instdb2-manage.svc:7276:BootstrapBasicMessaging"/>
  </jmsQueueConnectionFactory>
  <connectionManager id="mifjmsconfact" maxPoolSize="20"/>

  <!-- JNDI name used by the queue records in Manage  ->  queue defined on the JMS server -->
  <jmsQueue id="jms/maximo/int/queues/sqout" jndiName="jms/maximo/int/queues/sqout">
    <properties.wasJms queueName="sqoutbd"/>
  </jmsQueue>
  <jmsQueue id="jms/maximo/int/queues/sqin" jndiName="jms/maximo/int/queues/sqin">
    <properties.wasJms queueName="sqinbd"/>
  </jmsQueue>
  <jmsQueue id="jms/maximo/int/queues/cqin" jndiName="jms/maximo/int/queues/cqin">
    <properties.wasJms queueName="cqinbd"/>
  </jmsQueue>
  <jmsQueue id="jms/maximo/int/queues/cqinerr" jndiName="jms/maximo/int/queues/cqinerr">
    <properties.wasJms queueName="cqinerrbd"/>
  </jmsQueue>
  <jmsQueue id="jms/maximo/int/queues/cqout" jndiName="jms/maximo/int/queues/cqout">
    <properties.wasJms queueName="cqoutbd"/>
  </jmsQueue>
  <jmsQueue id="jms/maximo/int/queues/cqouterr" jndiName="jms/maximo/int/queues/cqouterr">
    <properties.wasJms queueName="cqouterrbd"/>
  </jmsQueue>
  <jmsQueue id="jms/maximo/int/queues/notf" jndiName="jms/maximo/int/queues/notf">
    <properties.wasJms queueName="notfbd"/>
  </jmsQueue>
  <jmsQueue id="jms/maximo/int/queues/notferr" jndiName="jms/maximo/int/queues/notferr">
    <properties.wasJms queueName="notferrbd"/>
  </jmsQueue>

  <!-- consumers of the continuous queues: message-driven beans inside the Manage server -->
  <jmsActivationSpec id="maximo-all/mboejb/JMSContQueueProcessor-1" maxEndpoints="5">
    <properties.wasJms destinationRef="jms/maximo/int/queues/cqin" destinationType="javax.jms.Queue"
                       remoteServerAddress="instdb2-wsp-jms.mas-instdb2-manage.svc:7276:BootstrapBasicMessaging"/>
  </jmsActivationSpec>
  <jmsActivationSpec id="maximo-all/mboejb/JMSContQueueProcessor-2" maxEndpoints="1">
    <properties.wasJms destinationRef="jms/maximo/int/queues/cqinerr" destinationType="javax.jms.Queue"
                       remoteServerAddress="instdb2-wsp-jms.mas-instdb2-manage.svc:7276:BootstrapBasicMessaging"/>
  </jmsActivationSpec>
  <!-- the same two again for cqout and cqouterr: JMSContOutQueueProcessor-1 and -2 -->
</server>
Notice what this file is: the bridge between the two halves you have already seen. On the left, the JNDI names
that Manage's queue records hold (jms/maximo/int/queues/sqout). On the right, the queues that exist on
the JMS server (sqoutbd). The file is stored in OpenShift as a secret:
Shell$ oc create secret generic wsp-all-jms-client -n mas-instdb2-manage \
     --from-file=server-custom.xml=server-custom.xml
secret/wsp-all-jms-client created
Step 2. The workspace. This is the change to the ManageWorkspace resource. It can be applied as a
patch, typed into the YAML editor of the OpenShift console, or entered on the suite's Update configuration page:
YAML$ oc patch manageworkspace instdb2-wsp -n mas-instdb2-manage --type merge -p '
spec:
  settings:
    deployment:
      defaultJMS: true                         # message beans for the continuous queues
      persistentVolumes:
        - pvcName: manage-jms
          mountPath: /jmsstore                 # the path the JMS server writes its store to
          size: 5Gi
          storageClassName: ocs-external-storagecluster-cephfs
          accessModes: [ReadWriteMany]
      serverBundles:
        - name: all                            # the existing Manage server bundle ...
          bundleType: all
          isDefault: true
          isMobileTarget: true
          isUserSyncTarget: true
          replica: 1
          routeSubDomain: all
          additionalServerConfig:
            secretName: wsp-all-jms-client     # ... now with the client XML of step 1
        - name: jms                            # new: the JMS server
          bundleType: standalonejms
          isDefault: false
          isMobileTarget: false
          isUserSyncTarget: false
          replica: 1
          routeSubDomain: jms
'
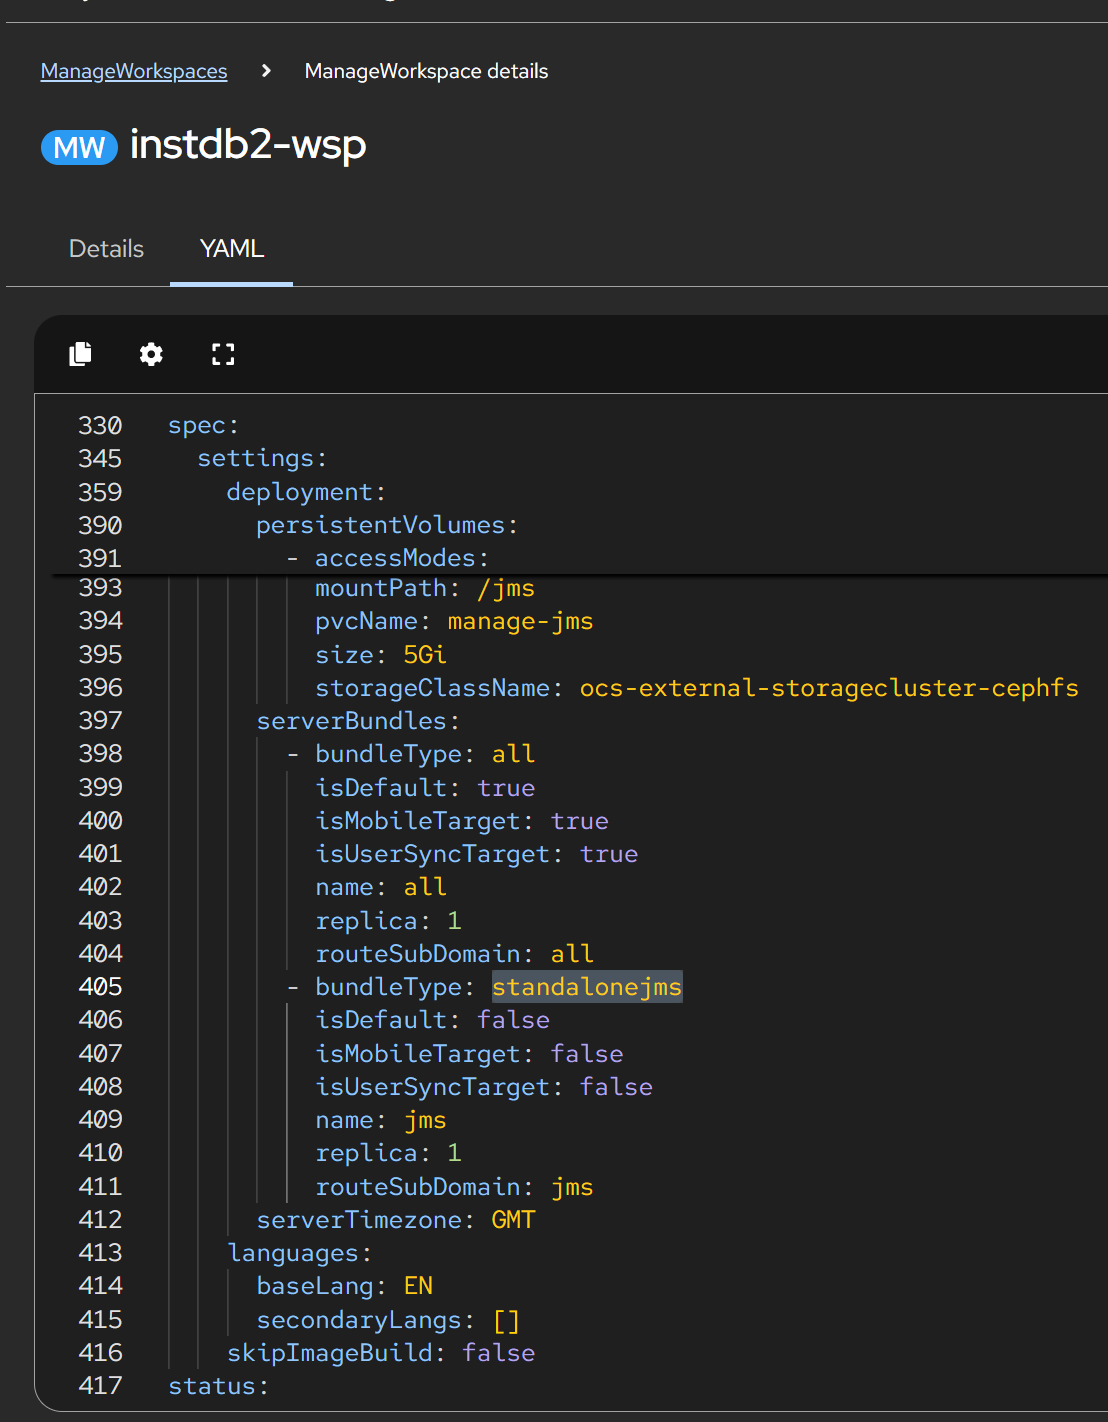
ManageWorkspace resource of the workspace, tab YAML. The second server bundle is the JMS server.defaultJMS: true does not create a JMS server. The name suggests it. I set it first, the operator
rebuilt and restarted Manage, and there was still no messaging server. It only switches on the message beans.
The volume belongs at /jmsstore. I first mounted it at /jms. The volume was
attached, empty, and ignored: the JMS server's configuration says <fileStore path="/jmsstore"/>, and
that directory was still the container's temporary disk. Read the generated server.xml before trusting a
mount path.
Give every jmsQueue an id. My first version of the client XML had only the JNDI names. The
server started, and the log said CWWKG0033W: The value [jms/maximo/int/queues/cqin] specified for the reference
attribute [destinationRef] was not found, followed by J2CA8802E: The message endpoint activation failed. An
activation specification finds its queue by id, not by JNDI name. With the ids in place the errors were gone.
A running JMS pod does not mean Manage can use it. With the server up, the Manage pod's own configuration
still contained no queue. The client XML of step 1 is not optional, and each bundle type needs its own variant:
all and mea get the activation specifications, ui, cron and
report get only the connection factory and the queues.
What happens after you save, and how to read the status page
The change is not instant. Adding a bundle makes the operator rebuild the Manage images and roll the pods. On this cluster the image build took about fifteen minutes, and each roll-out of the pods a few more. The suite shows the progress under Administration > Workspace > Manage.
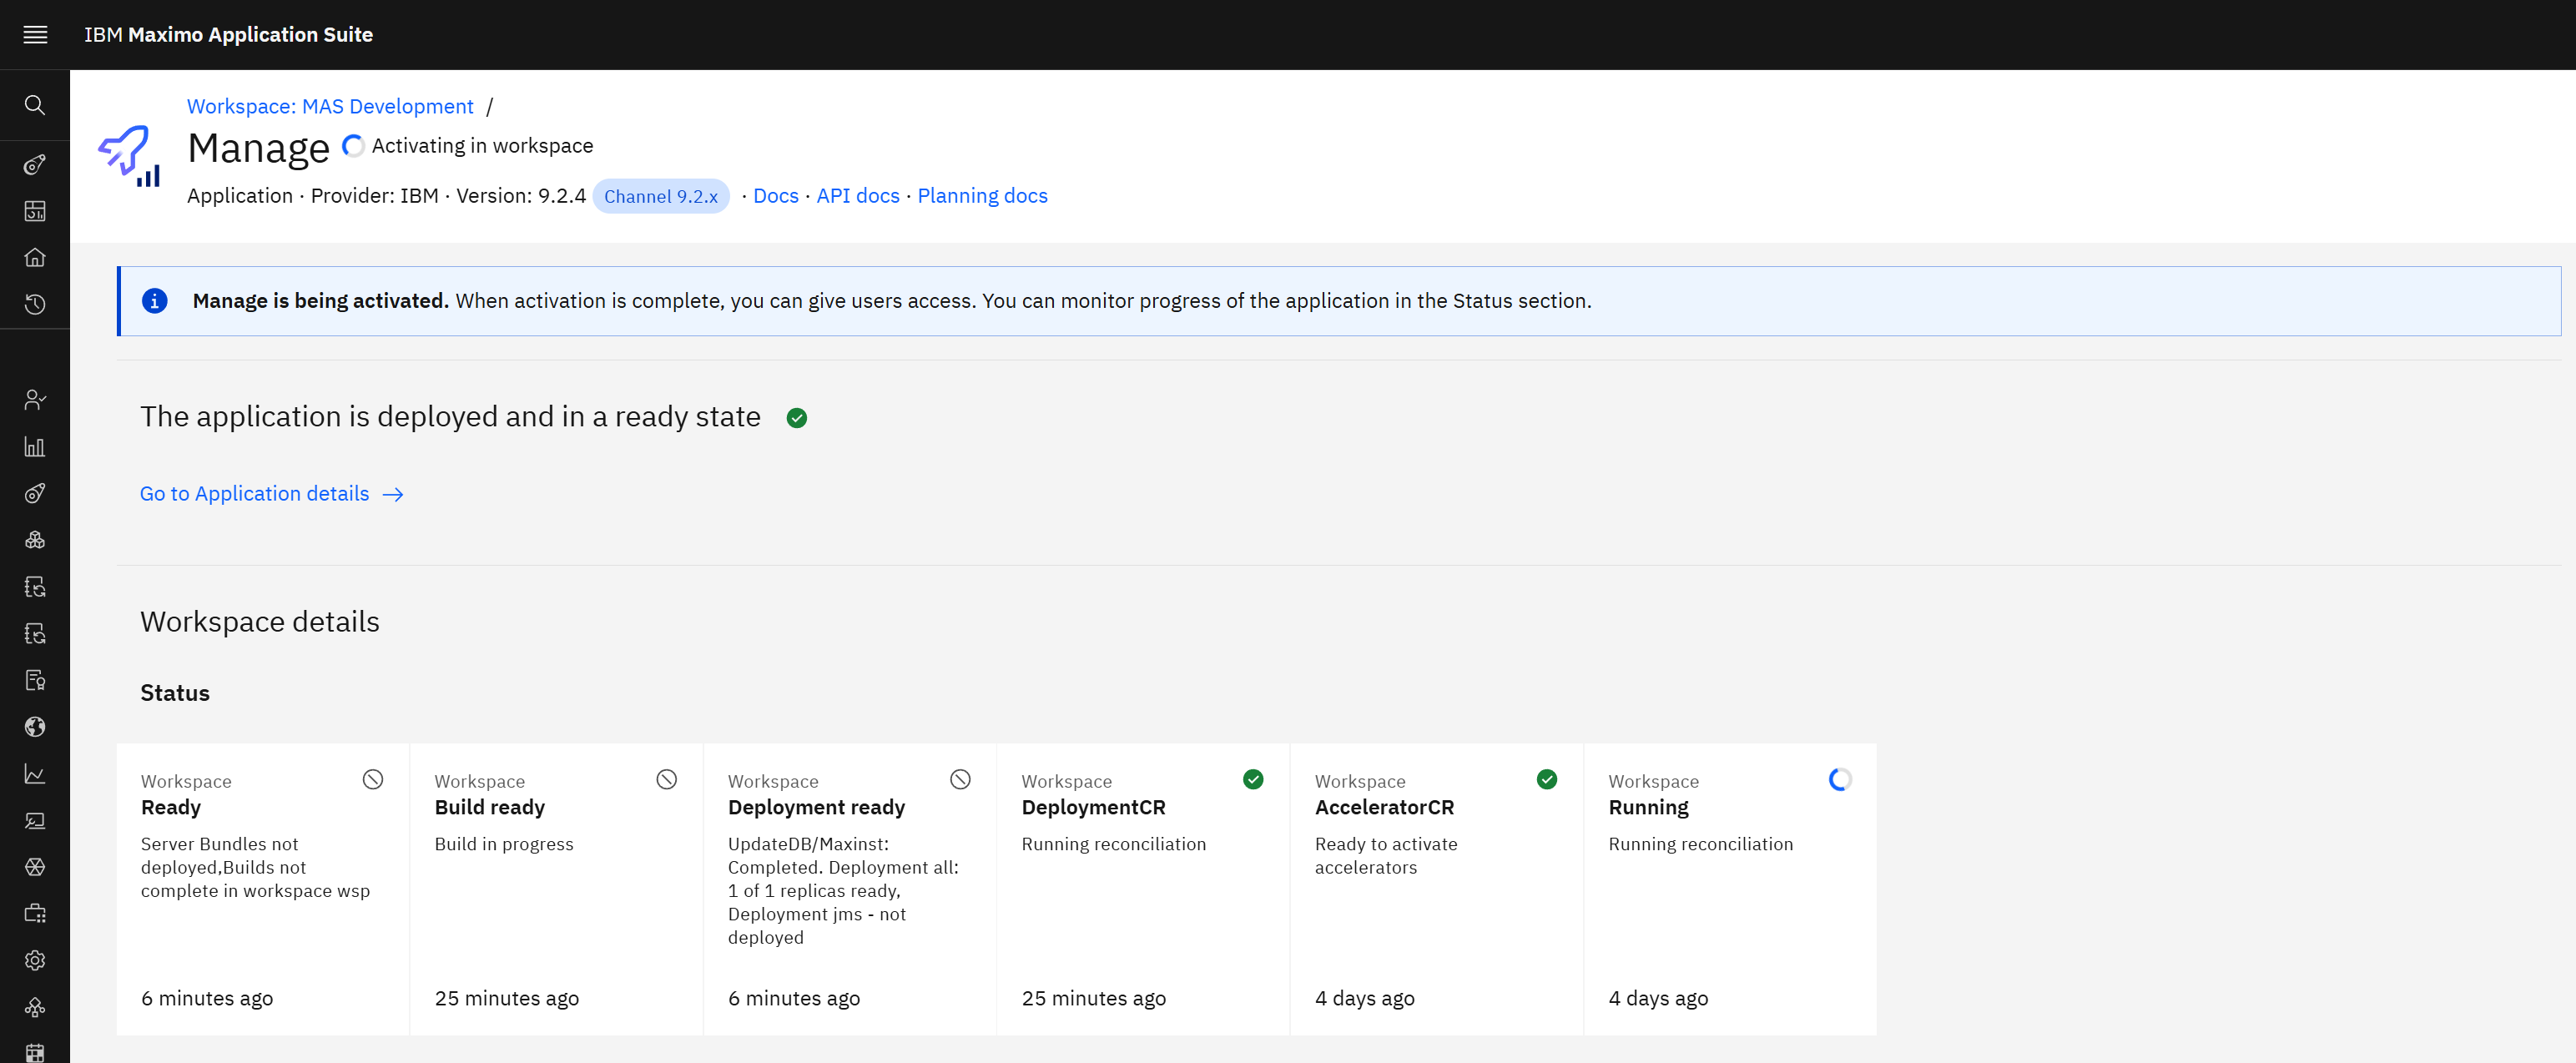
This page confuses everybody the first time, because it seems to say two opposite things: "The application is deployed and in a ready state" with a green tick, and "Activating in workspace" with a spinner. Both are true. They describe two different resources:
| Part of the page | Resource behind it | What it tells you |
|---|---|---|
| "The application is deployed and in a ready state" | ManageApp: Manage as a product installed in the suite (its operator, its version, its channel) | The operator is installed and healthy. It says nothing about any workspace. |
| "Activating in workspace" and the six tiles | ManageWorkspace: Manage as it runs for this workspace (database, images, pods) | The operator is still working on the configuration you changed. |
Each tile is one status condition of the ManageWorkspace resource. You can read the same six
lines with oc get manageworkspace … -o yaml, under status.conditions.
| Tile | Question it answers | In the screenshot |
|---|---|---|
| Ready | Is everything below finished? It is the summary of the others. | No: "Server Bundles not deployed, Builds not complete". |
| Build ready | Are the container images built? Manage images are built on your cluster, because they include your add-ons, languages and customizations. | "Build in progress": the new image is being produced by an OpenShift build. |
| Deployment ready | Did the database update run, and is every server bundle running with the expected number of pods? | Database step completed; bundle all has 1 of 1 pod; bundle jms "not deployed" yet. |
| DeploymentCR | Did the operator hand the configuration to its helper resources without an error? | Green: it did, and it is reconciling. |
| AcceleratorCR | Are the industry accelerators ready to be activated? | Green, unchanged for four days. Not involved in this change. |
| Running | Is the operator working right now? | Spinner: a reconciliation is in progress. When it stops, read Ready. |
The time under each tile is when that condition last changed, which is the quickest way to see what is moving. When all tiles are green and the spinner is gone, the page switches from "Activation in progress" to the configuration summary.
The roll-out restarts Manage. Users of Manage are logged out. Other suite applications take their user permissions from Manage, so for a few minutes Monitor answered "unauthorized" to an administrator. Do it in a maintenance window, and tell people.
What you get: the JMS server and its queues
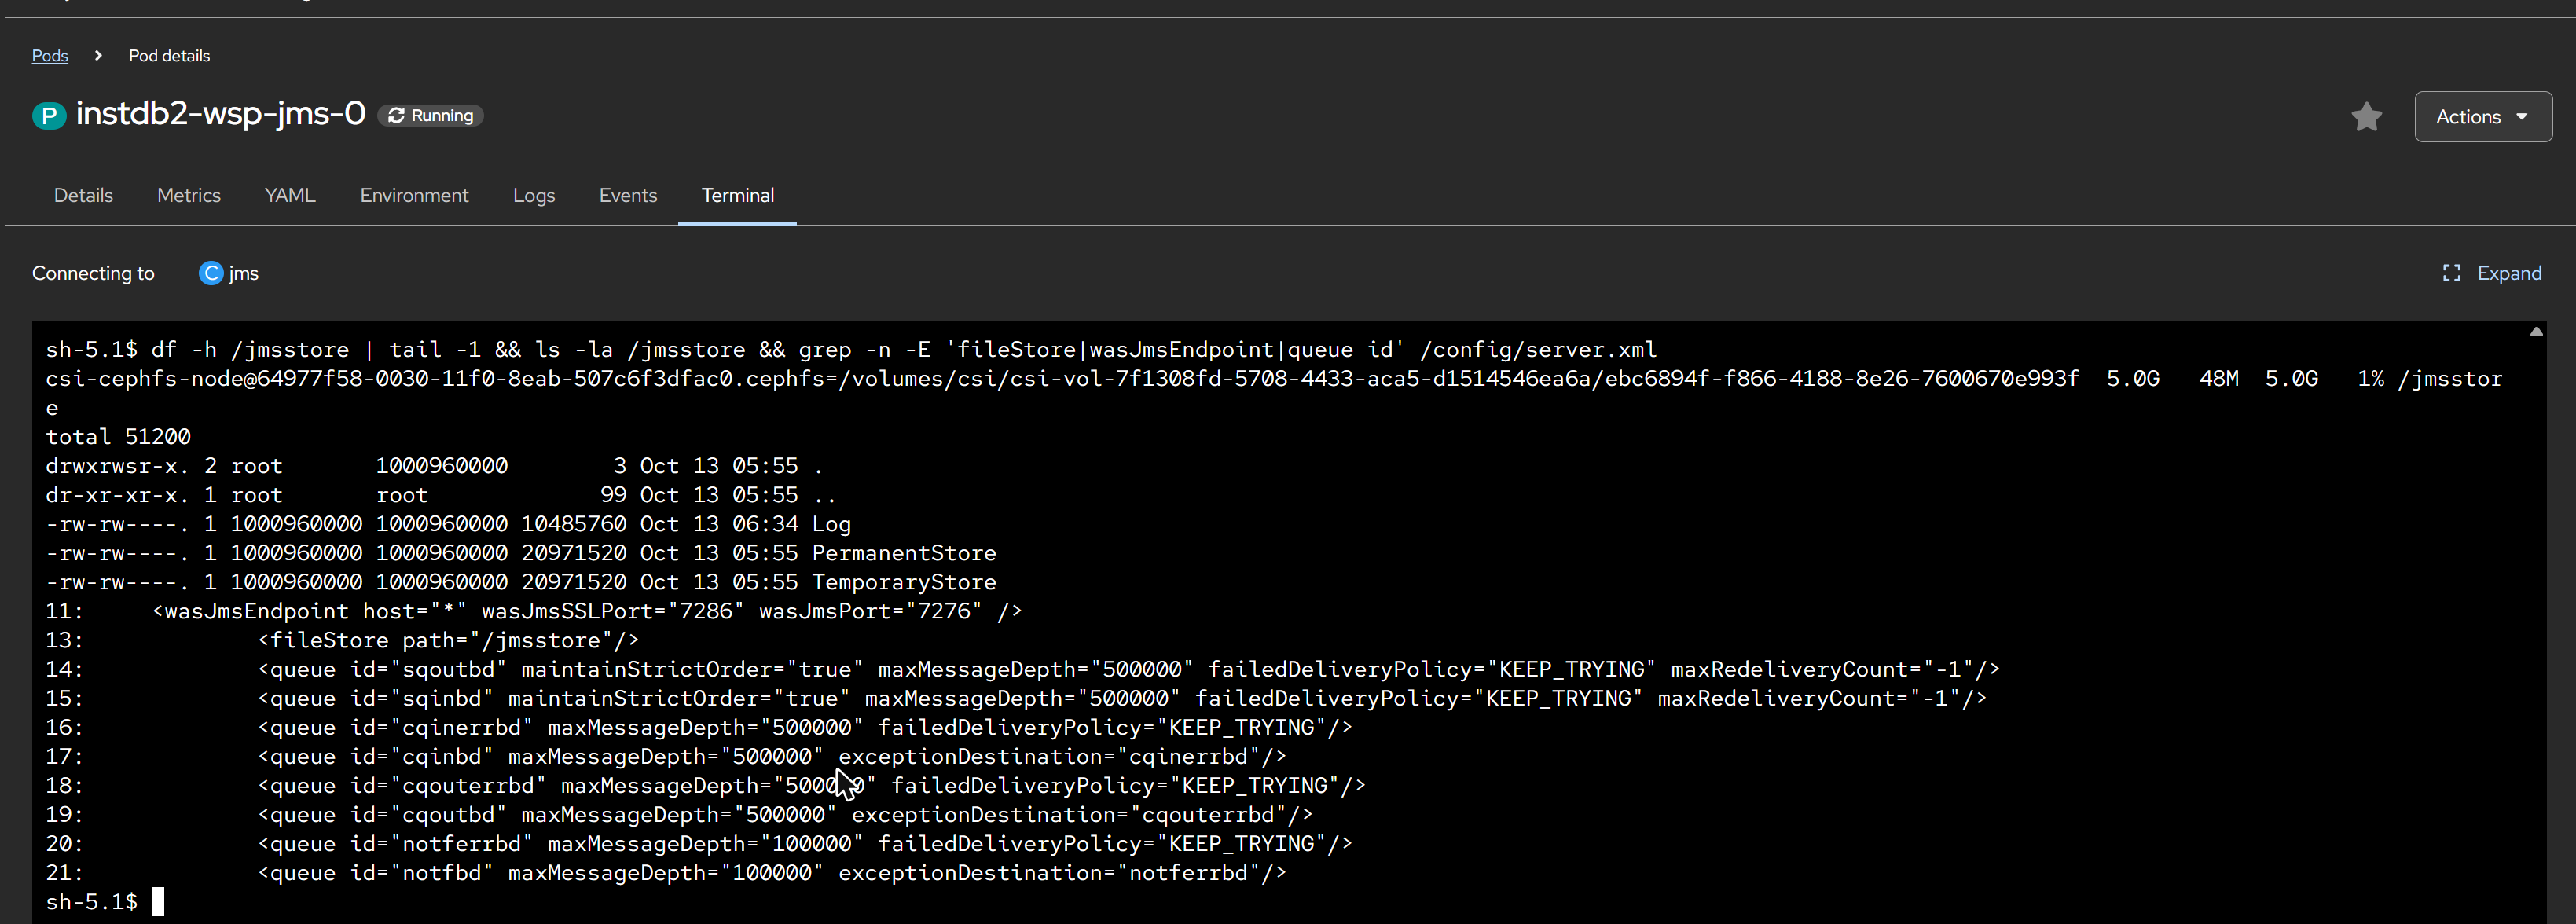
/jmsstore is now a 5 GiB persistent volume; it holds the three files of the message store (Log, PermanentStore, TemporaryStore); below them, the queue definitions from the generated server.xml.That terminal output is worth reading line by line, because it is the physical answer to "where is my queue?":
| Line on the screen | What it tells you |
|---|---|
df -h /jmsstore → csi-cephfs-node@… 5.0G 48M 5.0G 1% /jmsstore | The directory is not the container's own disk. It is a network file system volume of 5 GiB, the persistent volume claim from the workspace settings. 48 MB are used, which is the empty store. If this line showed overlay, the store would be temporary. |
Log (10 MB) | The store's transaction log. Its time, 06:34, is the last moment a message was put or taken, here the inbound message of exercise 4. |
PermanentStore (20 MB) | The persistent messages of all queues. There is one store per messaging engine, not one file per queue. The file is created at its starting size and grows when needed. |
TemporaryStore (20 MB) | Non-persistent messages and working data. Lost on restart by design. |
Owner 1000960000 | The user ID OpenShift gave this project. The volume must be writable for it, which is why the access mode and storage class matter. |
wasJmsEndpoint … 7286 / 7276 | The ports the JMS server listens on, with and without TLS. The client XML of step 1 points at 7276. |
fileStore path="/jmsstore" | The link between the configuration and the three files above. |
The eight queue id=… lines | The queues that exist. Sequential ones keep strict order and retry for ever; continuous ones send failures to their error queue. |
A queue is working storage, not an archive, so the store is rarely backed up on its own. What matters is that the
volume survives a pod restart (it now does) and that it does not fill up: a partner that is down for a week, with a
sequential queue that keeps trying, makes PermanentStore grow. Watch the queue depth, not only the disk.
This is where Maximo's queued messages physically are: in PermanentStore, on that volume, until a
consumer takes them. The generated configuration of the pod is short enough to read in full, and it answers most
questions about Maximo queues:
XML<featureManager>
    <feature>wasJmsSecurity-1.0</feature>
    <feature>wasJmsServer-1.0</feature>                       <!-- this pod IS the messaging server -->
</featureManager>
<wasJmsEndpoint host="*" wasJmsSSLPort="7286" wasJmsPort="7276" />   <!-- Manage connects here -->
<messagingEngine>
    <fileStore path="/jmsstore"/>                             <!-- where messages are kept -->
    <queue id="sqoutbd"   maintainStrictOrder="true" maxMessageDepth="500000"
           failedDeliveryPolicy="KEEP_TRYING" maxRedeliveryCount="-1"/>
    <queue id="sqinbd"    maintainStrictOrder="true" maxMessageDepth="500000"
           failedDeliveryPolicy="KEEP_TRYING" maxRedeliveryCount="-1"/>
    <queue id="cqinerrbd" maxMessageDepth="500000" failedDeliveryPolicy="KEEP_TRYING"/>
    <queue id="cqinbd"    maxMessageDepth="500000" exceptionDestination="cqinerrbd"/>
    <queue id="cqouterrbd" maxMessageDepth="500000" failedDeliveryPolicy="KEEP_TRYING"/>
    <queue id="cqoutbd"   maxMessageDepth="500000" exceptionDestination="cqouterrbd"/>
    <queue id="notferrbd" maxMessageDepth="100000" failedDeliveryPolicy="KEEP_TRYING"/>
    <queue id="notfbd"    maxMessageDepth="100000" exceptionDestination="notferrbd"/>
</messagingEngine>
Read it against the table of Part 7 and the theory becomes configuration:
- The two sequential queues have
maintainStrictOrder="true"andKEEP_TRYINGwith unlimited redelivery: a failing message is retried in place, and nothing overtakes it. - The continuous queues have an
exceptionDestination: a failing message is moved to the error queue and the rest carry on. maxMessageDepthis the size of the waiting room: 500,000 messages per queue.- The names end in
bd(bus destination). Manage's queue records point to them through JNDI names such asjms/maximo/int/queues/sqout.
Part 9Exercises 3 and 4: a message out, a message in
With a messaging server in place, the framework can be used the way the diagrams of Part 7 show. Both exercises use the same partner, a pretend ERP.
Set up the partner
Step 1. The external system. In Integration > External Systems choose New External System. Name
it DEMOERP, pick an end point, pick the queues, tick Enabled, save. The end point here is the
delivered MXXMLFILE, which simply writes each outbound message to a file. It is the easiest one to verify,
and swapping it later for an HTTP or Kafka end point changes nothing else.
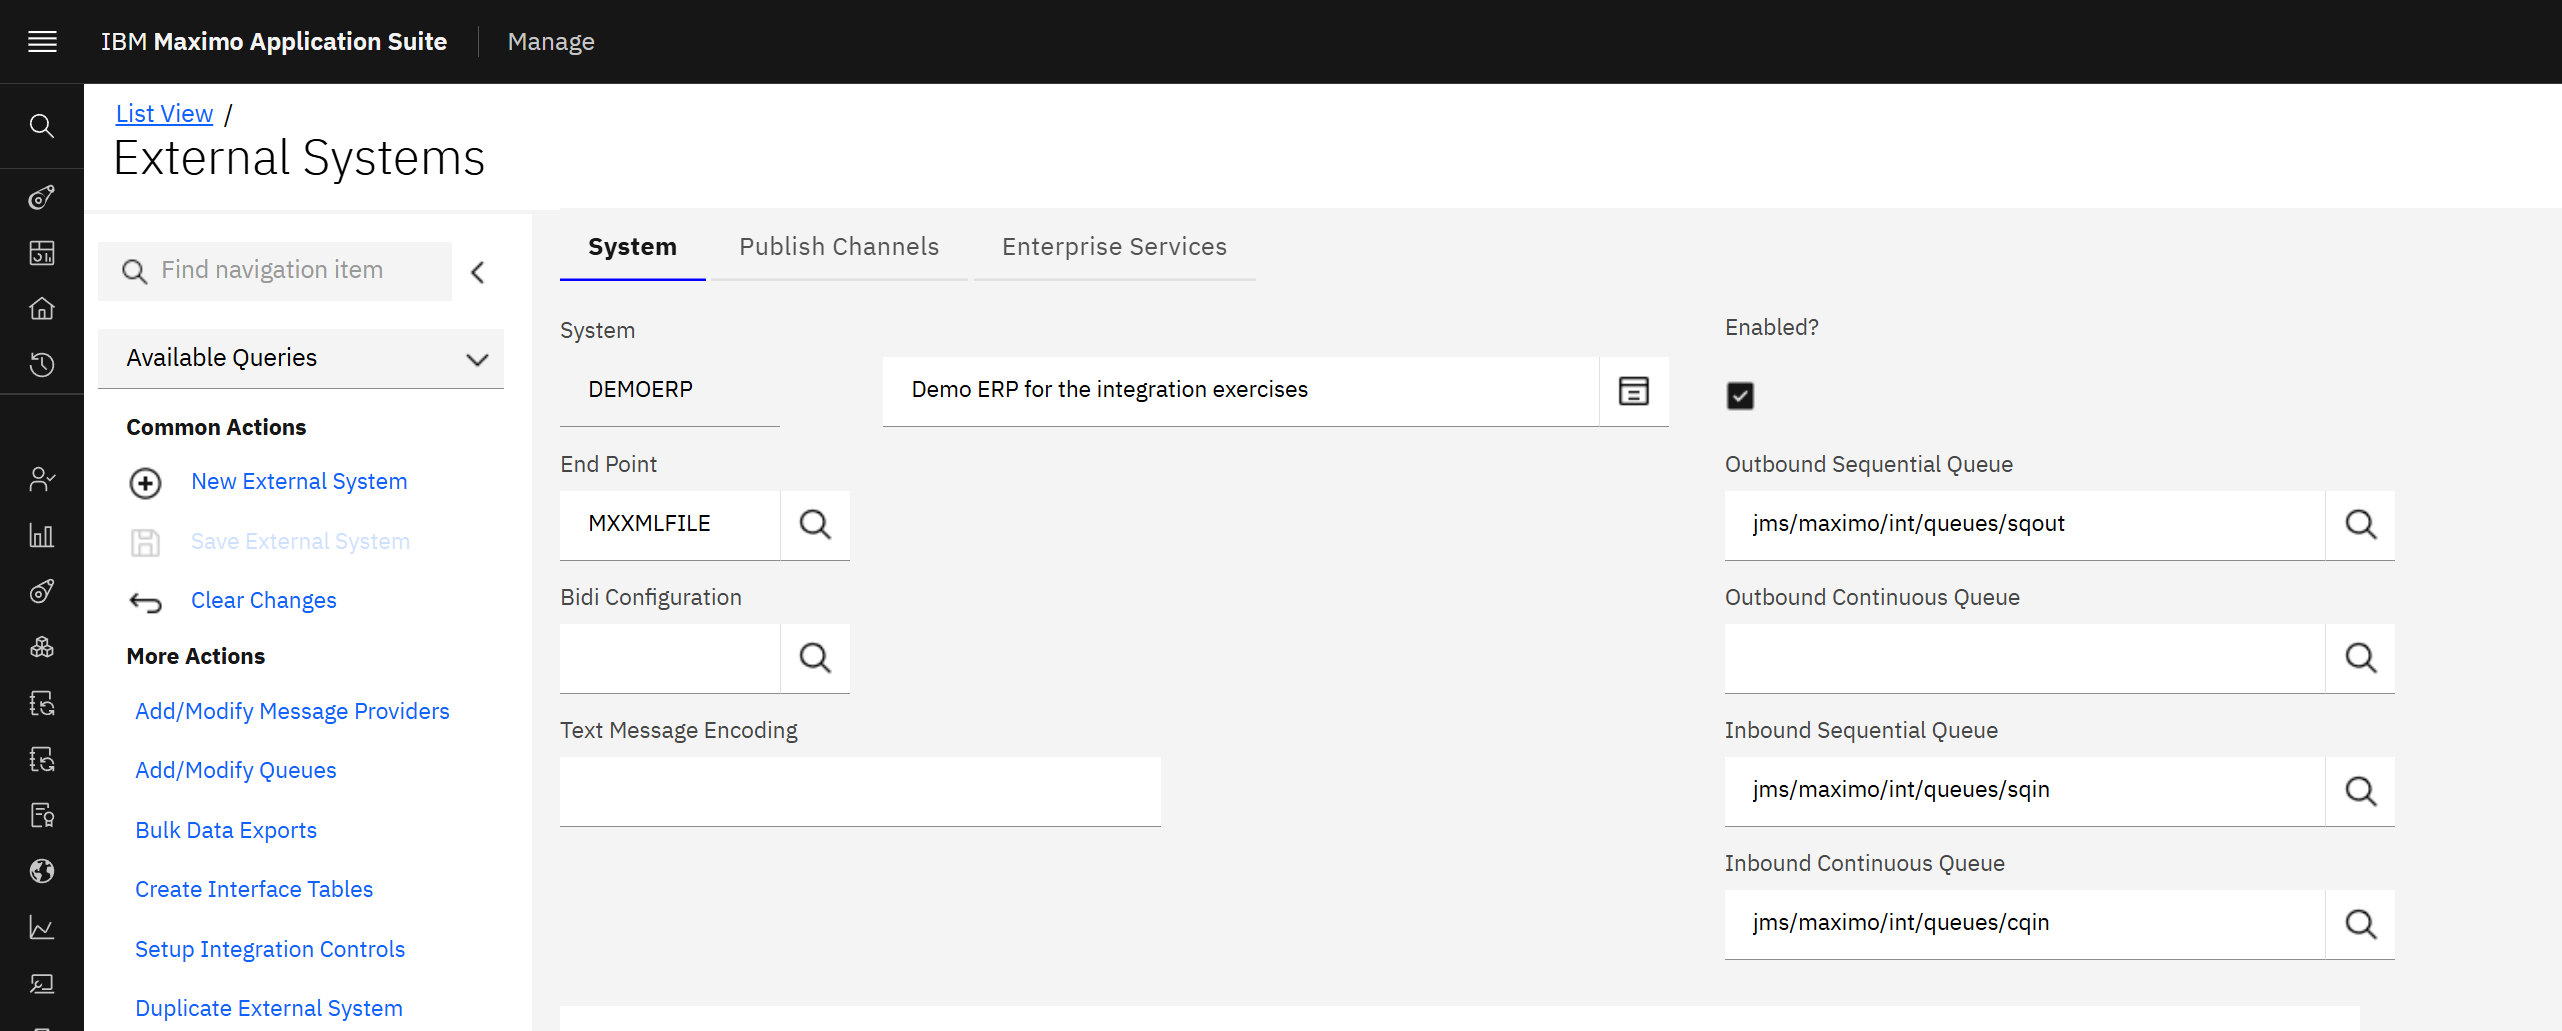
My first save lost the end point and two of the three queues, although the fields looked filled. In this application a typed value only counts once the field has been left and validated; the lookup always works. Check the record after saving.
Step 2. What flows. On the tab Publish Channels add MXASSETInterface and tick Enabled: assets
go out. On the tab Enterprise Services add MXASSETInterface, tick Enabled, and clear Use Continuous
Queue? so that inbound assets use the sequential queue and arrive in order. Save.
Step 3. Switch the channel on. A publish channel only reacts to saves when its listener is enabled. Open
Integration > Publish Channels, find MXASSETInterface, and choose Enable Event Listener. While
you are there, choose Message Tracking, tick Enable Message Tracking and Store Message, and save.
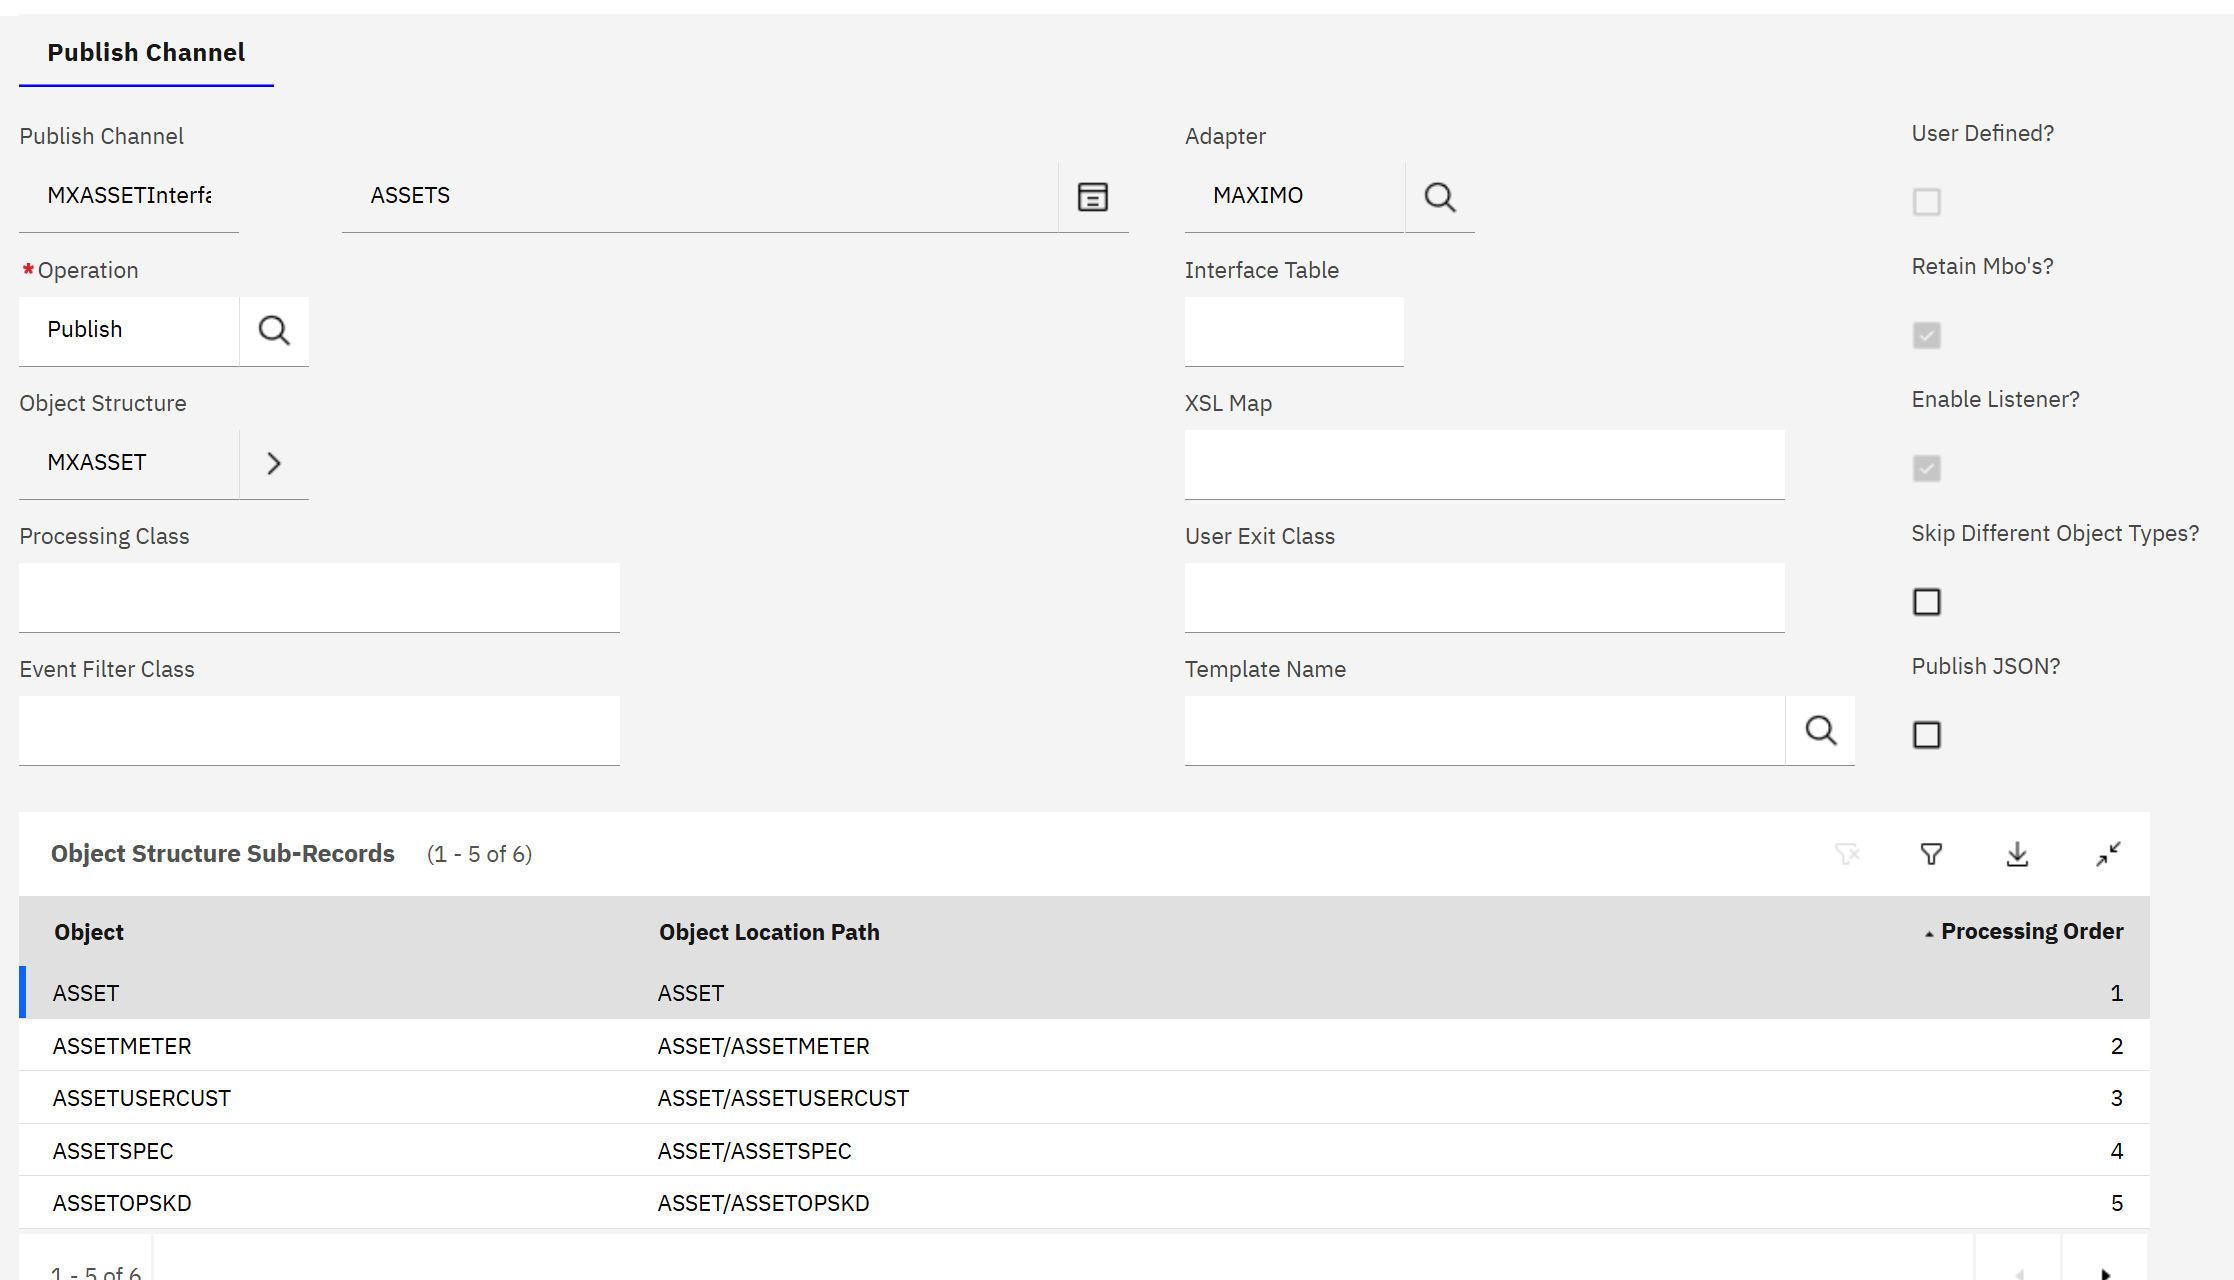
MXASSET, whose sub-records (meters, specifications and so on) travel with the asset. Enable Listener is now ticked.Exercise 3: a message out
Step 1. Create an asset in Assets: number PUMP-001, description "Cooling water pump 1". Save.
For the user, that is all. Nothing on the screen says that a message was produced.
Step 2. Find the message in the queue. Back in External Systems, open Add/Modify Queues, select the row
jms/maximo/int/queues/sqout, and choose Actions > View Queue Data with Count Only? ticked.
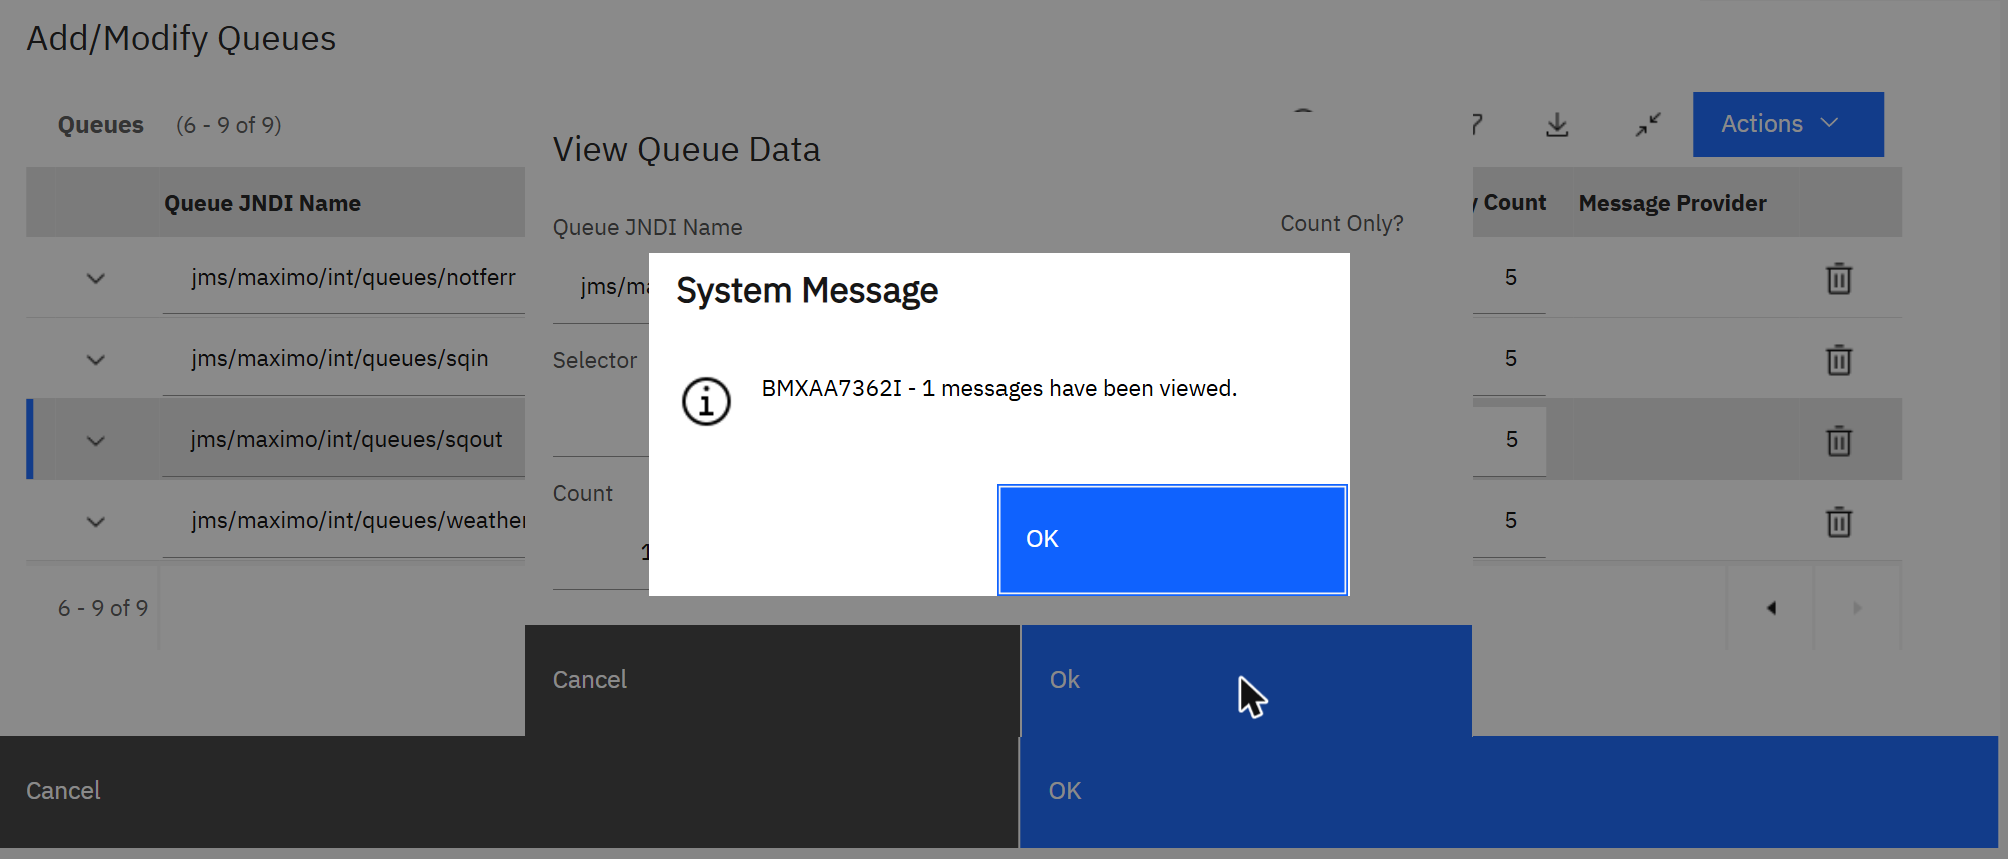
sqout, and the answer is one.One message, and it is not moving. Why? Because nothing is reading the queue yet.
Step 3. Start the consumer. Sequential queues are read by a cron task, and on a new system its instances are
not active. Open System Configuration > Platform Configuration > Cron Task Setup, find
JMSQSEQCONSUMER, tick Active? for SEQQOUT and SEQQIN, and save.
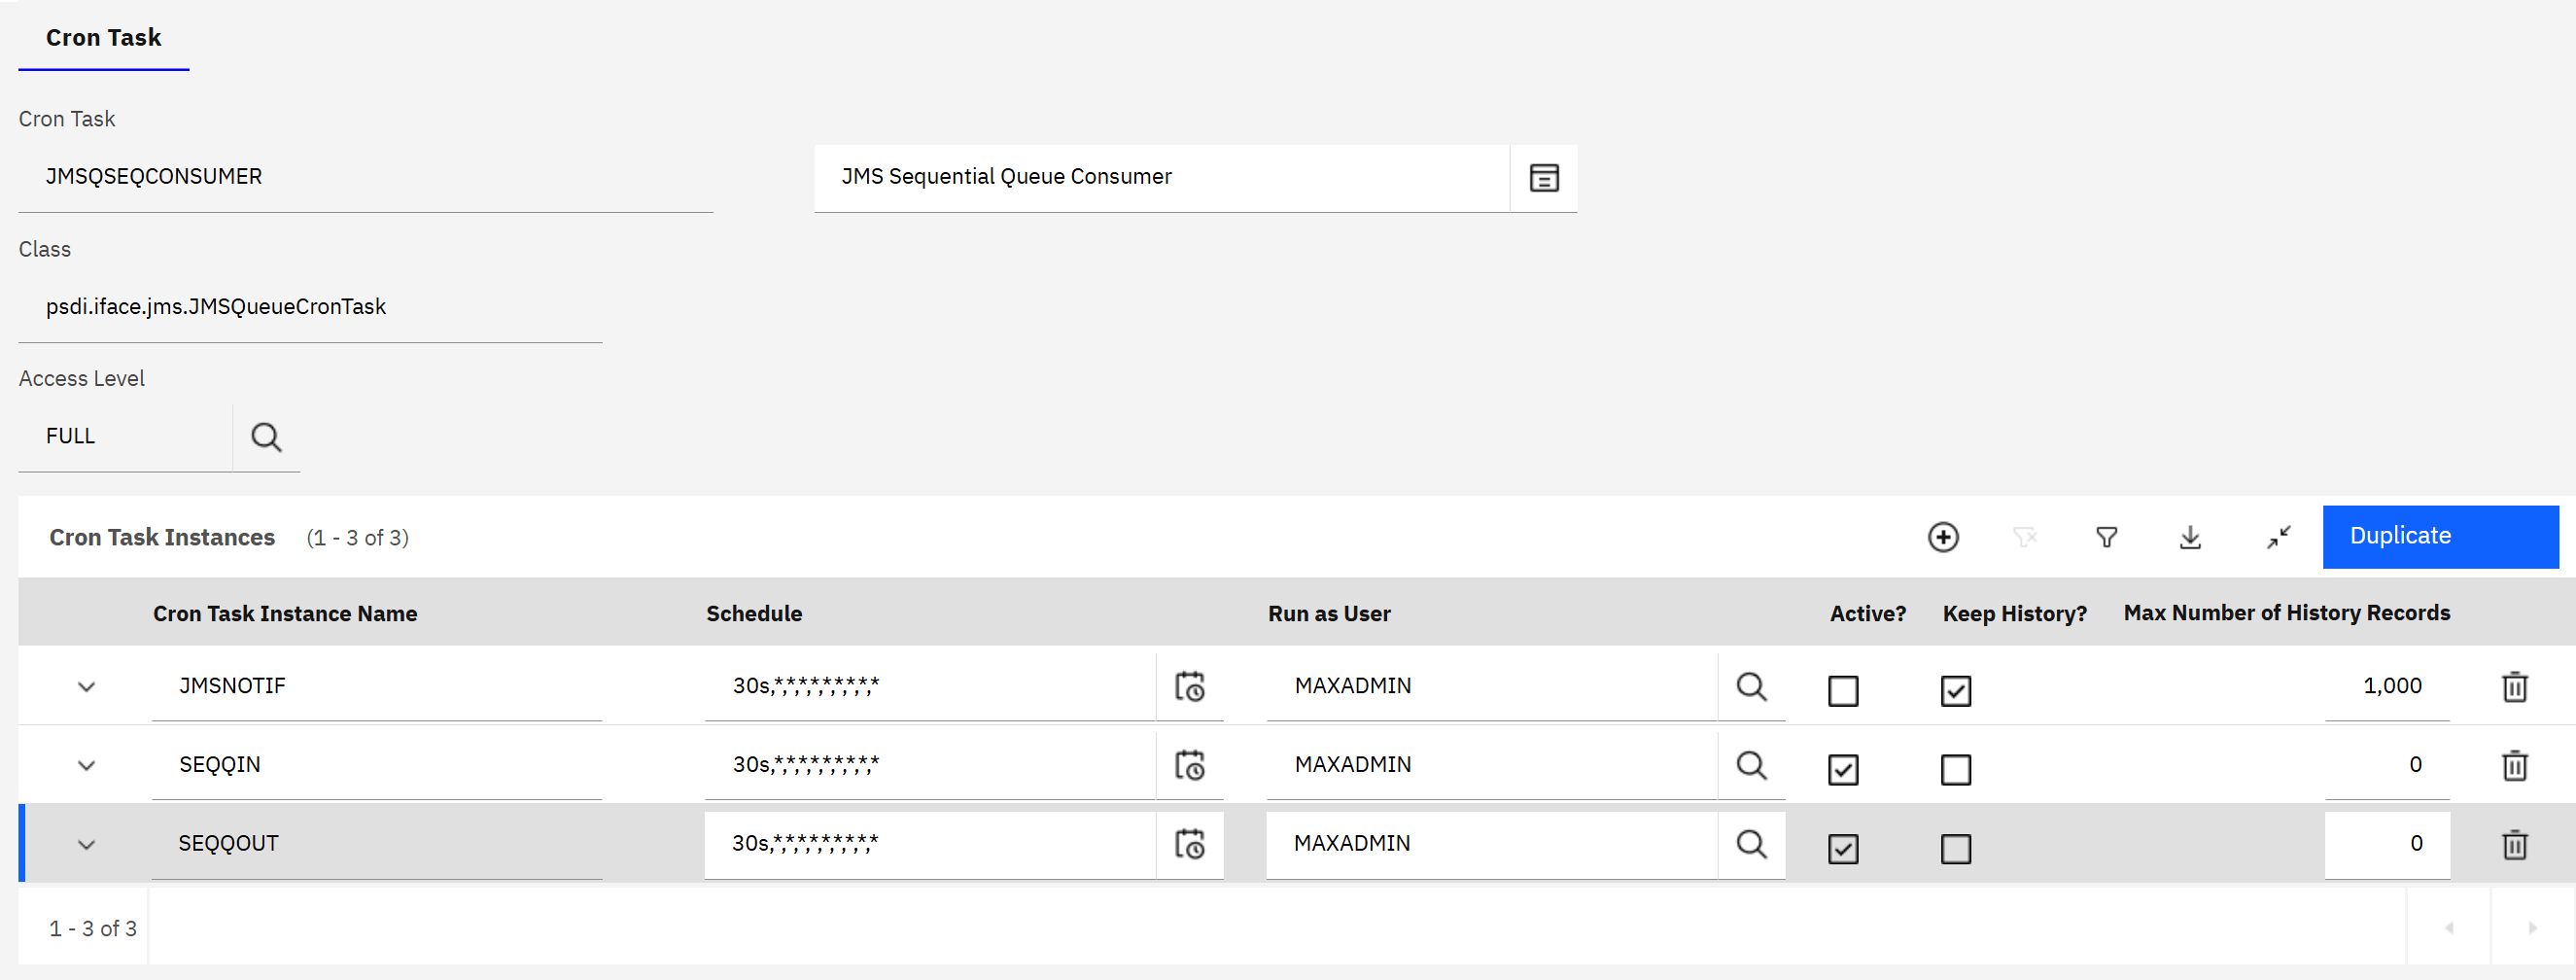
SEQQIN and SEQQOUT are now active.Within a minute the server log shows the hand-over, and the end point has written its file:
Output[CID-CRON-437] Message 2530637.179187229887528509 processed by JMS Queue Cron Task
               JMSQSEQCONSUMER.SEQQOUT, destjndiname = jms/maximo/int/queues/sqout

$ oc exec -n mas-instdb2-manage <manage-pod> -- ls -la /opt/ibm/wlp/output/defaultServer/xmlfiles/
-rw-r-----. 1 1000960000 root 7888 Oct 13 06:29 DEMOERP_MXASSETInterface_2530637.179187229887528509.xml
The file is the asset as the partner would receive it. Shortened:
XML<PublishMXASSET xmlns="http://www.ibm.com/maximo" creationDateTime="2026-10-13T06:18:18+00:00"
                messageID="1453117918722980361594" event="1">
  <MXASSETSet>
    <ASSET action="Add">
      <ASSETNUM>PUMP-001</ASSETNUM>
      <DESCRIPTION>Cooling water pump 1</DESCRIPTION>
      <SITEID>BEDFORD</SITEID>
      <STATUS>NOT READY</STATUS>
      ... about 200 more fields ...
    </ASSET>
  </MXASSETSet>
</PublishMXASSET>
The message was created at 06:18:18, when the asset was saved. It was delivered at 06:29, when the cron task was switched on. For eleven minutes it existed only in the JMS server's store. That gap is what "asynchronous" means, and it is why a queue protects the user from a slow or absent partner.
Step 4. The history. The queue is empty again, so where is the proof? In Integration > Message Tracking, because tracking was switched on for the channel.
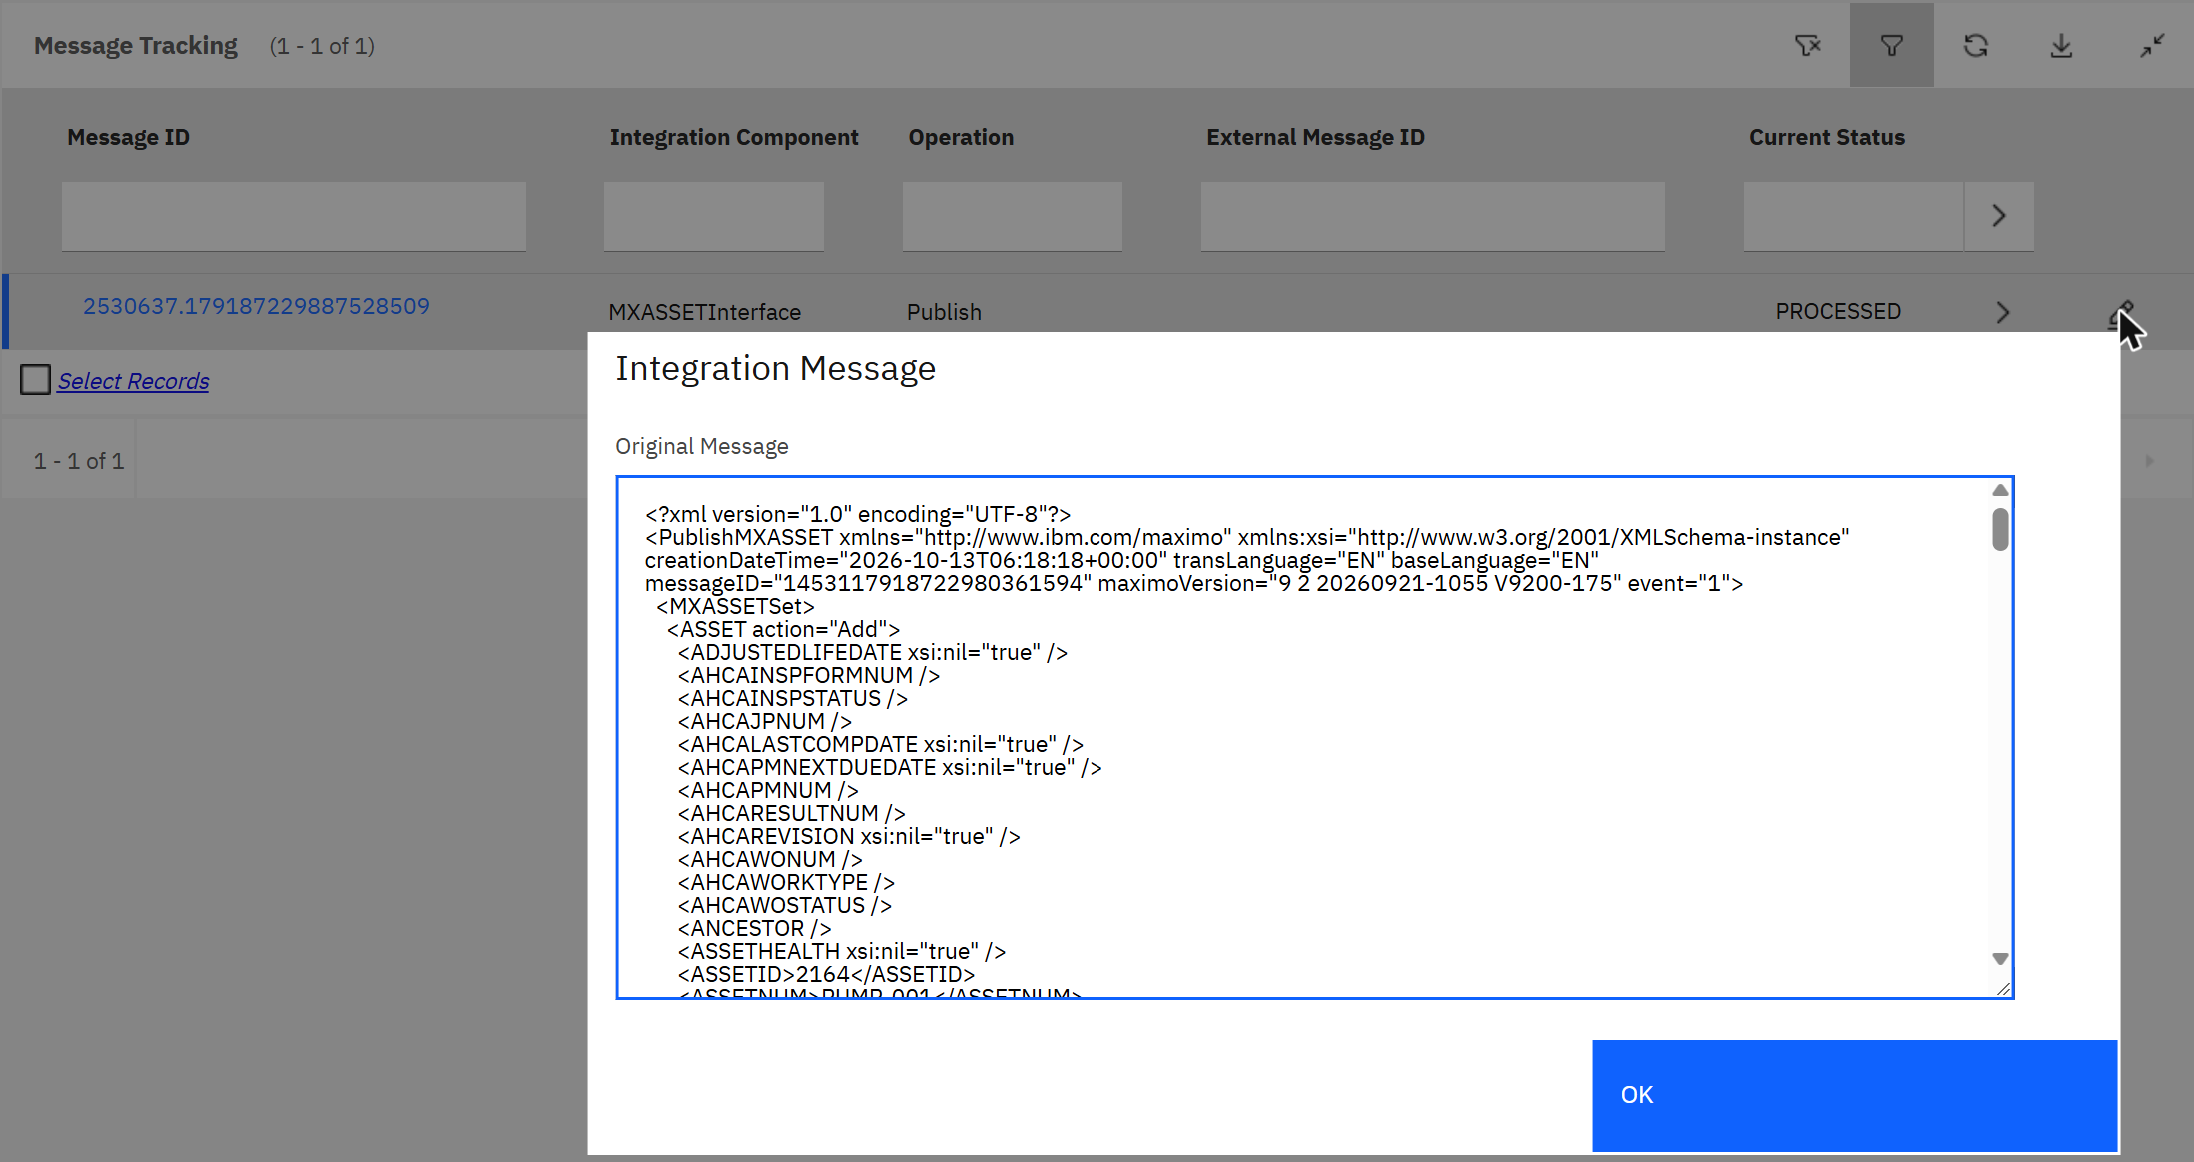
The XML file end point wrote into the Manage pod's own file system. A pod restart removes it. It is fine for a first test. For real file exchange give the end point a directory on a persistent volume; better, use an HTTP or Kafka end point and let the receiving side keep its own copy.
Exercise 4: a message in
Now the ERP sends an asset. An enterprise service can be reached in several ways: over HTTP at
/meaweb/es/<external system>/<service>, from a file, from an interface table, from a queue. On
the suite the HTTP door answers 401 API Key required to an unidentified caller, so a real partner is given an
API key. For a first test there is a door that needs no key: the Data Import action of the external system. It
puts the file's content through the same queue and the same processing.
Step 1. Save this as pump-002.xml:
XML<?xml version="1.0" encoding="UTF-8"?>
<SyncMXASSET xmlns="http://www.ibm.com/maximo">
  <MXASSETSet>
    <ASSET>
      <ASSETNUM>PUMP-002</ASSETNUM>
      <DESCRIPTION>Cooling water pump 2 (sent by the ERP)</DESCRIPTION>
      <SITEID>BEDFORD</SITEID>
    </ASSET>
  </MXASSETSet>
</SyncMXASSET>
Three fields are enough. The object structure fills in the rest with the same defaults and validations as the
Assets application. Sync means "create it if it is new, update it if it exists".
Step 2. In External Systems open DEMOERP, tab Enterprise Services, select the row, and choose
Actions > Data Import. Pick the file, leave XML File selected, and confirm.
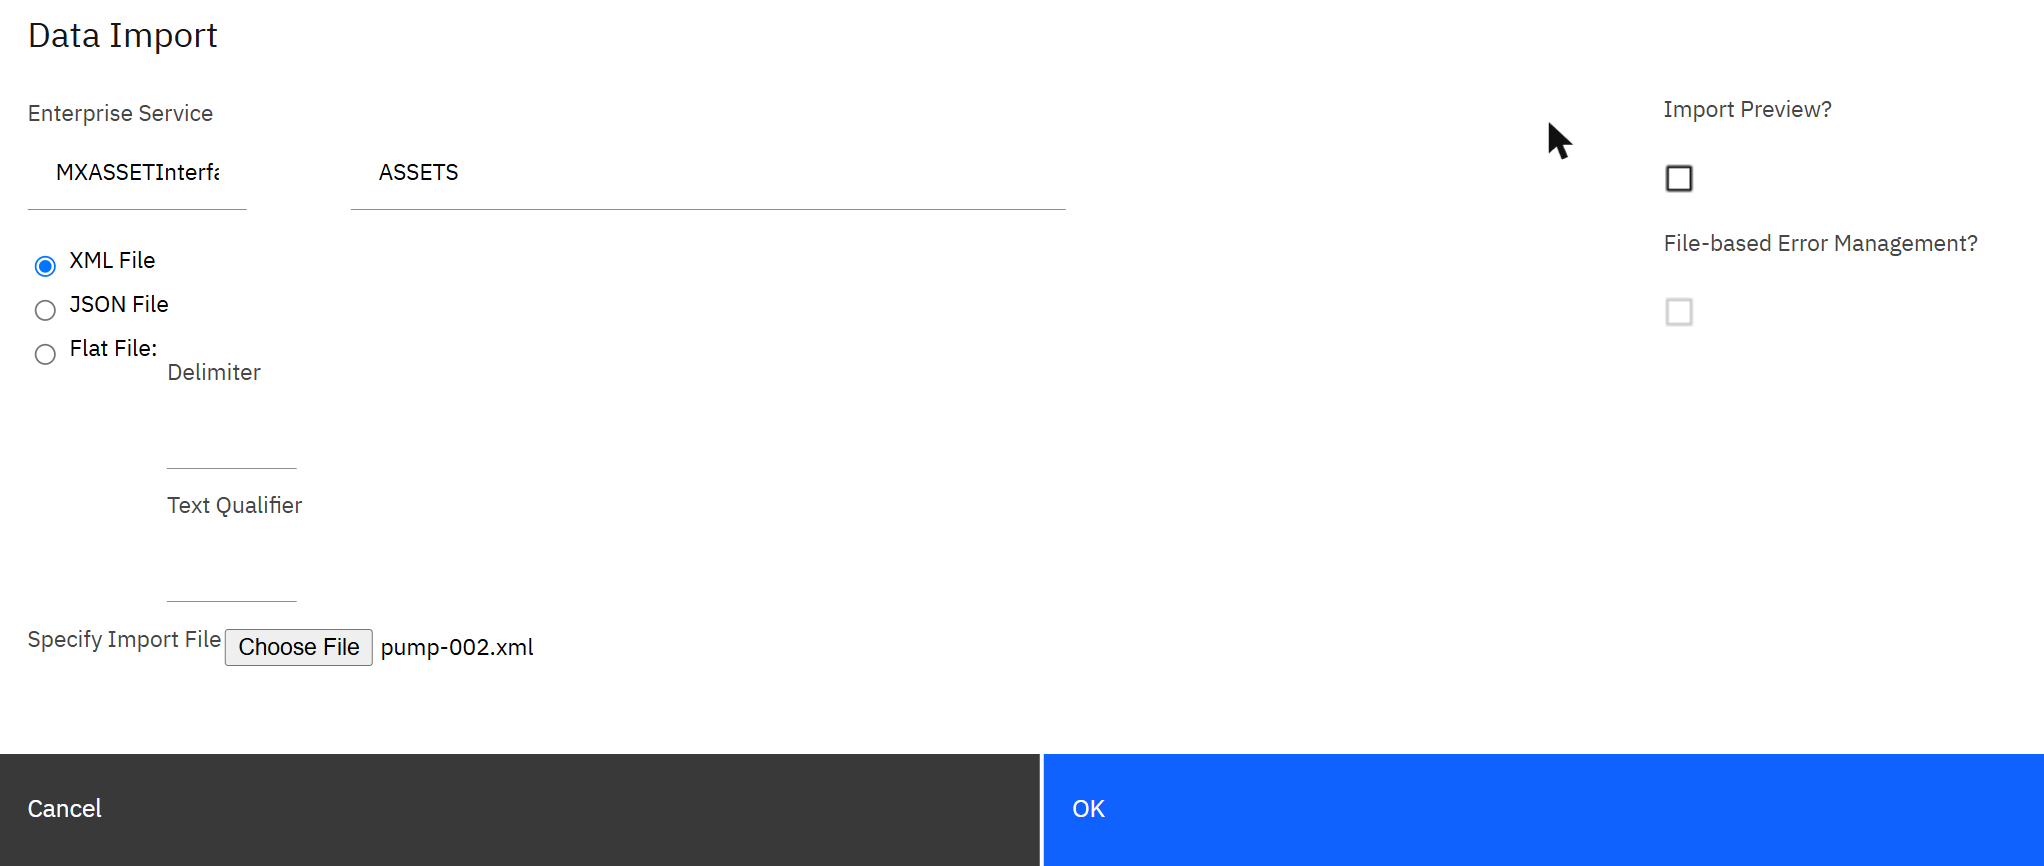
Manage answers "Inbound transaction has been processed successfully to queue." Read that sentence carefully. It says to queue. The asset does not exist yet.
Step 3. It fails. And it did, on this system. No asset appeared. The place to look is Integration > Message Reprocessing.

sqin, status RETRY, with the error that stopped it.The server log tells the same story, with the full text:
Output[CID-CRON-697] got message 9635157.1791873245883959498 from queue jms/maximo/int/queues/sqin
[ERROR] Processing failed for MXASSETInterface. ...
        BMXAA9301E - The user of the transaction is not authorized for Object Structure MXASSET.
        Configure authorization in the object structure application and grant necessary access to the user.
[ERROR] Message 9635157.1791873245883959498 processing was unsucessful by JMS Queue Cron Task
        JMSQSEQCONSUMER.SEQQIN
It shows three things at once. First, "accepted" is not "processed": the sender got a success message and the record was still refused. Second, an inbound message is processed as a user, with that user's rights, exactly like a person at the screen. Third, a failed message is not lost. It waits in the queue, the cron task tried it again every 30 seconds up to the queue's Maximum Try Count of 5, and then it left it for a human. Because the queue is sequential, everything sent after it would wait behind it.
Step 4. Fix the cause, not the message. An object structure has to be told whose security it follows. In
Integration > Object Structures open MXASSET, choose Configure Object Structure Security,
set Authorization Name to the application ASSET with the lookup, confirm and save. From now on the object structure follows the security of the Assets application: a user who may create assets on
the screen may create them through the integration.
Step 5. Replay. Back in Message Reprocessing, tick the message and choose Process Selected Messages. The list empties, and the asset is there.

PUMP-001 now exists three times: as a device in Monitor sending readings over MQTT and Kafka, as an asset in Manage, and as a message that left Manage through a JMS queue for the ERP. Linking the device to the asset is the last step of a real project: after that, an alert on the device's vibration opens work against the right asset.
And Kafka, for the queues of Manage?
Manage can also use Kafka instead of JMS for its integration queues. The action Add/Modify Message Providers in External Systems is where a Kafka cluster is declared (servers, user, password, security settings), and each queue record has a Message Provider column that says which provider it lives on. The framework above it stays the same: the same channels, services and Message Reprocessing. It is worth considering when Kafka is already the company's backbone, because the partner systems can then read Maximo's topics directly. I did not run that configuration for this guide, so take this paragraph as a pointer, not as a tested recipe.
Part 10Where every message lives
The question a support engineer asks first is "where is my message right now?". Here is the whole guide on one page.
| Technology | Stored where | For how long | Processed by | How to look |
|---|---|---|---|---|
| MQTT (IoT tool) | Nowhere durable for device events. The broker passes them on. | Moments. | The MQTT proxy, which writes each event to Kafka. | Monitor, device, tab Recent event. |
| Kafka | Segment files (.log) in a directory per partition, on the volume of each broker, copied to three brokers. | The retention time. Here 24 hours or 1 GiB per partition. | Every consumer group that reads the topic, each with its own offset. | A consumer, or kafka-dump-log.sh in a broker pod's terminal. |
| Monitor | Tables in Monitor's database, one set per device type. | Until archived or deleted. | The ingest pods, then the scheduled analysis that calculates metrics and alerts. | Monitor, device, tab Data. |
| JMS queue (Manage) | The file store of the JMS server pod: /jmsstore, files PermanentStore, TemporaryStore and Log. | Until a consumer takes the message. Then it is gone from the queue. | Sequential queues: cron task JMSQSEQCONSUMER. Continuous queues: message beans in the Manage server. | External Systems, Add/Modify Queues, action View Queue Data. |
| MIF history (Manage) | Tables in the Maximo database: tracked messages and failed messages. | Until purged. Plan a clean-up. | You, in the applications Message Tracking and Message Reprocessing. | The Integration module of Manage. |
A queue is not a record. Once a JMS message is consumed it no longer exists in the queue. If the business needs to prove what was sent, switch on message tracking for that channel. The history then lives in the database, not in the queue.
Kafka is not an archive either. With a retention of one day, a consumer that is down for a weekend comes back to missing data. Size the retention for the longest outage you must survive, and monitor consumer lag.
Part 11When it does not work
| Symptom | Look here first |
|---|---|
| MQTT client connects and is dropped at once | Client ID pattern, device type and ID spelling, token. Then: is another program using the same client ID? |
| Events show under Recent event but the metric is empty | The JSON field name against the metric name, and the event name against the metric's event. |
| Nothing in Monitor, but the device publishes without error | The Kafka topic of device events: are offsets moving? If yes, look at Monitor's ingest pods. If no, look at the MQTT proxy pods. |
| A Kafka client cannot connect from a laptop | It must use the external route on port 443, the cluster's CA certificate, and SCRAM-SHA-512. The internal address only works inside OpenShift. |
| Writing to a new Kafka topic fails | Topics are not created automatically on this cluster. Create a KafkaTopic resource first. |
| Publish channel enabled, nothing leaves Manage | Is the external system enabled? Is the channel enabled inside it? Is the event listener on? Does a JMS server exist (Part 8)? Is the cron task for the sequential queue active? |
Outbound messages pile up in sqout | A sequential queue stops at the first failing message. Open Message Reprocessing, read the error, fix or delete that one message. |
| An inbound message was accepted but the record is not there | "Accepted" only means "put in the queue". Look in Message Reprocessing for the business error. |
| Manage page says "Activating" for a long time after a change | The Build ready tile, then the builds in the Manage project of the OpenShift console. An image build takes a quarter of an hour or more. |
ValueWho gains what
Queues, topics and brokers are plumbing. This is what the plumbing buys.
| Who | What changes for them | How you would measure it |
|---|---|---|
| Plant and operations managers | A drifting reading becomes an alert and then a planned job, in place of a breakdown found on the night shift. | Unplanned downtime hours; share of corrective work that started from an alert. |
| Maintenance teams | Alerts arrive with the asset, the reading and its history attached, as a service request in the system they already use. | Time from alert to work order; alerts closed as noise. |
| Integration and IT teams | Systems are decoupled: when one is down, messages wait in a queue and are replayed, and a failed message can be corrected and reprocessed. | Messages lost; integration incidents; failed messages older than a day. |
| Finance and ERP owners | Assets, costs and purchases are the same record in both systems, moved by a tracked interface. | Reconciliation differences at period end; manual re-keying. |
| Architects | A clear rule for which tool carries what, which keeps the next project from inventing a fifth way. | Number of integration patterns in use. |
No figures are promised here. Record your own baseline for each measure before the change, and compare after one quarter.
GlossaryThe words, once more
- Broker
- A messaging server. Kafka has brokers; MQTT has a broker; the JMS server is one too.
- Consumer group
- A named set of Kafka readers sharing one position per partition.
- Custom resource
- A description of something you want on OpenShift (a Kafka cluster, a topic, a Manage workspace) that an operator turns into running pods.
- Device type / device
- The template and the individual thing in Monitor.
- End point
- The destination of an outbound MIF message and the handler that delivers it.
- Enterprise service
- The inbound side of MIF for one object structure.
- External system
- A partner in MIF: its channels, services and queues.
- Gateway
- Anything that connects to the suite on behalf of devices that cannot.
- Object structure
- The definition of a business document in Maximo; the base of MIF and of the REST API.
- Offset
- The position of a message in a Kafka partition.
- Operator
- Software on OpenShift that installs and looks after another piece of software.
- Partition
- One ordered slice of a Kafka topic.
- Publish channel
- The outbound side of MIF for one object structure.
- Sequential / continuous queue
- In order and one at a time, or in parallel with an error queue.
- Server bundle
- One group of Manage pods with one role: all, ui, cron, mea, report, or the stand-alone JMS server.
Built and tested on IBM Maximo Application Suite 9.2.7 with Manage 9.2.4, IoT 9.2.4 and Monitor 9.2.4 on Red Hat OpenShift, with Apache Kafka 3.9 run by the Strimzi operator 0.45, October 2026, on a demonstration cluster with demo data. Names, sizes, timings and settings are those of that one system. Product behaviour is described as observed there; the IBM and Red Hat documentation prevails.