IBM Maximo MRO Inventory Optimization · A guide for sellers and junior consultants
How many spare parts is enough?
Every storeroom holds too much of what it never uses and too little of what stops the plant. MRO Inventory Optimization (MIO) is sold as "it optimises spare parts", which explains nothing. This guide opens the box: how it thinks, what each user sees, and the eight scenes of IBM's own demo, with the reasoning a seller needs at each step.
- The four words behind every screen: reorder point, maximum, criticality, service level.
- How MIO turns a year of issues and receipts into a recommendation, and why most recommendations need no human.
- Eight scenes with eight personas: inventory, finance, maintenance, asset management, master data, reliability, supply chain and purchasing.
- The differentiators, with the proof on screen, and the questions that uncover a need.
Reading time: about 25 minutes, or jump to the scene you need. Screens are from IBM's MIO demo deck; the data comes from a real customer that allowed IBM to use it, about 42,000 stocked items.
Before we startThe one-sentence version
MRO means maintenance, repair and operations: the bearings, seals, motors, filters and cables that keep assets running. They behave nothing like products on a shop shelf. A part may be used twice in five years and still cost a day of production when it is missing.
Hold too little and a pump waits three weeks for a seal. Hold too much and millions sit on shelves, age, and are written off. Most storerooms do both at the same time, on different parts.
For every item in every storeroom it calculates how many to keep, by weighing what the part costs to hold against what it costs to be without it, and it keeps doing so every month.
Reorder point (ROP): when stock falls to this number, buy more. Maximum: buy up to this number. Criticality (MIO calls it business impact, A to E): how much it hurts when the part is missing. Service level: the chance, in percent, that the part is on the shelf when someone asks for it. Everything in MIO is a way of setting the first two from the last two.
How it worksA monthly loop, mostly automatic
MIO sits beside the EAM or ERP (Maximo, SAP, Oracle and others). It reads the item master, issues, receipts, suppliers, bills of materials and work orders. Each month it re-forecasts every item, recalculates the best reorder levels, and compares them with what is set today.
- Small, low-risk changes inside the company's policy are written back automatically.
- Changes that deserve a look land in a work queue.
- Changes above someone's authority go through an approval workflow.
Nobody can review 42,000 items a month. MIO's promise is that people only look at the few hundred where judgement adds value, and the rest is kept right without them.
The four screensWhat you will see in every scene
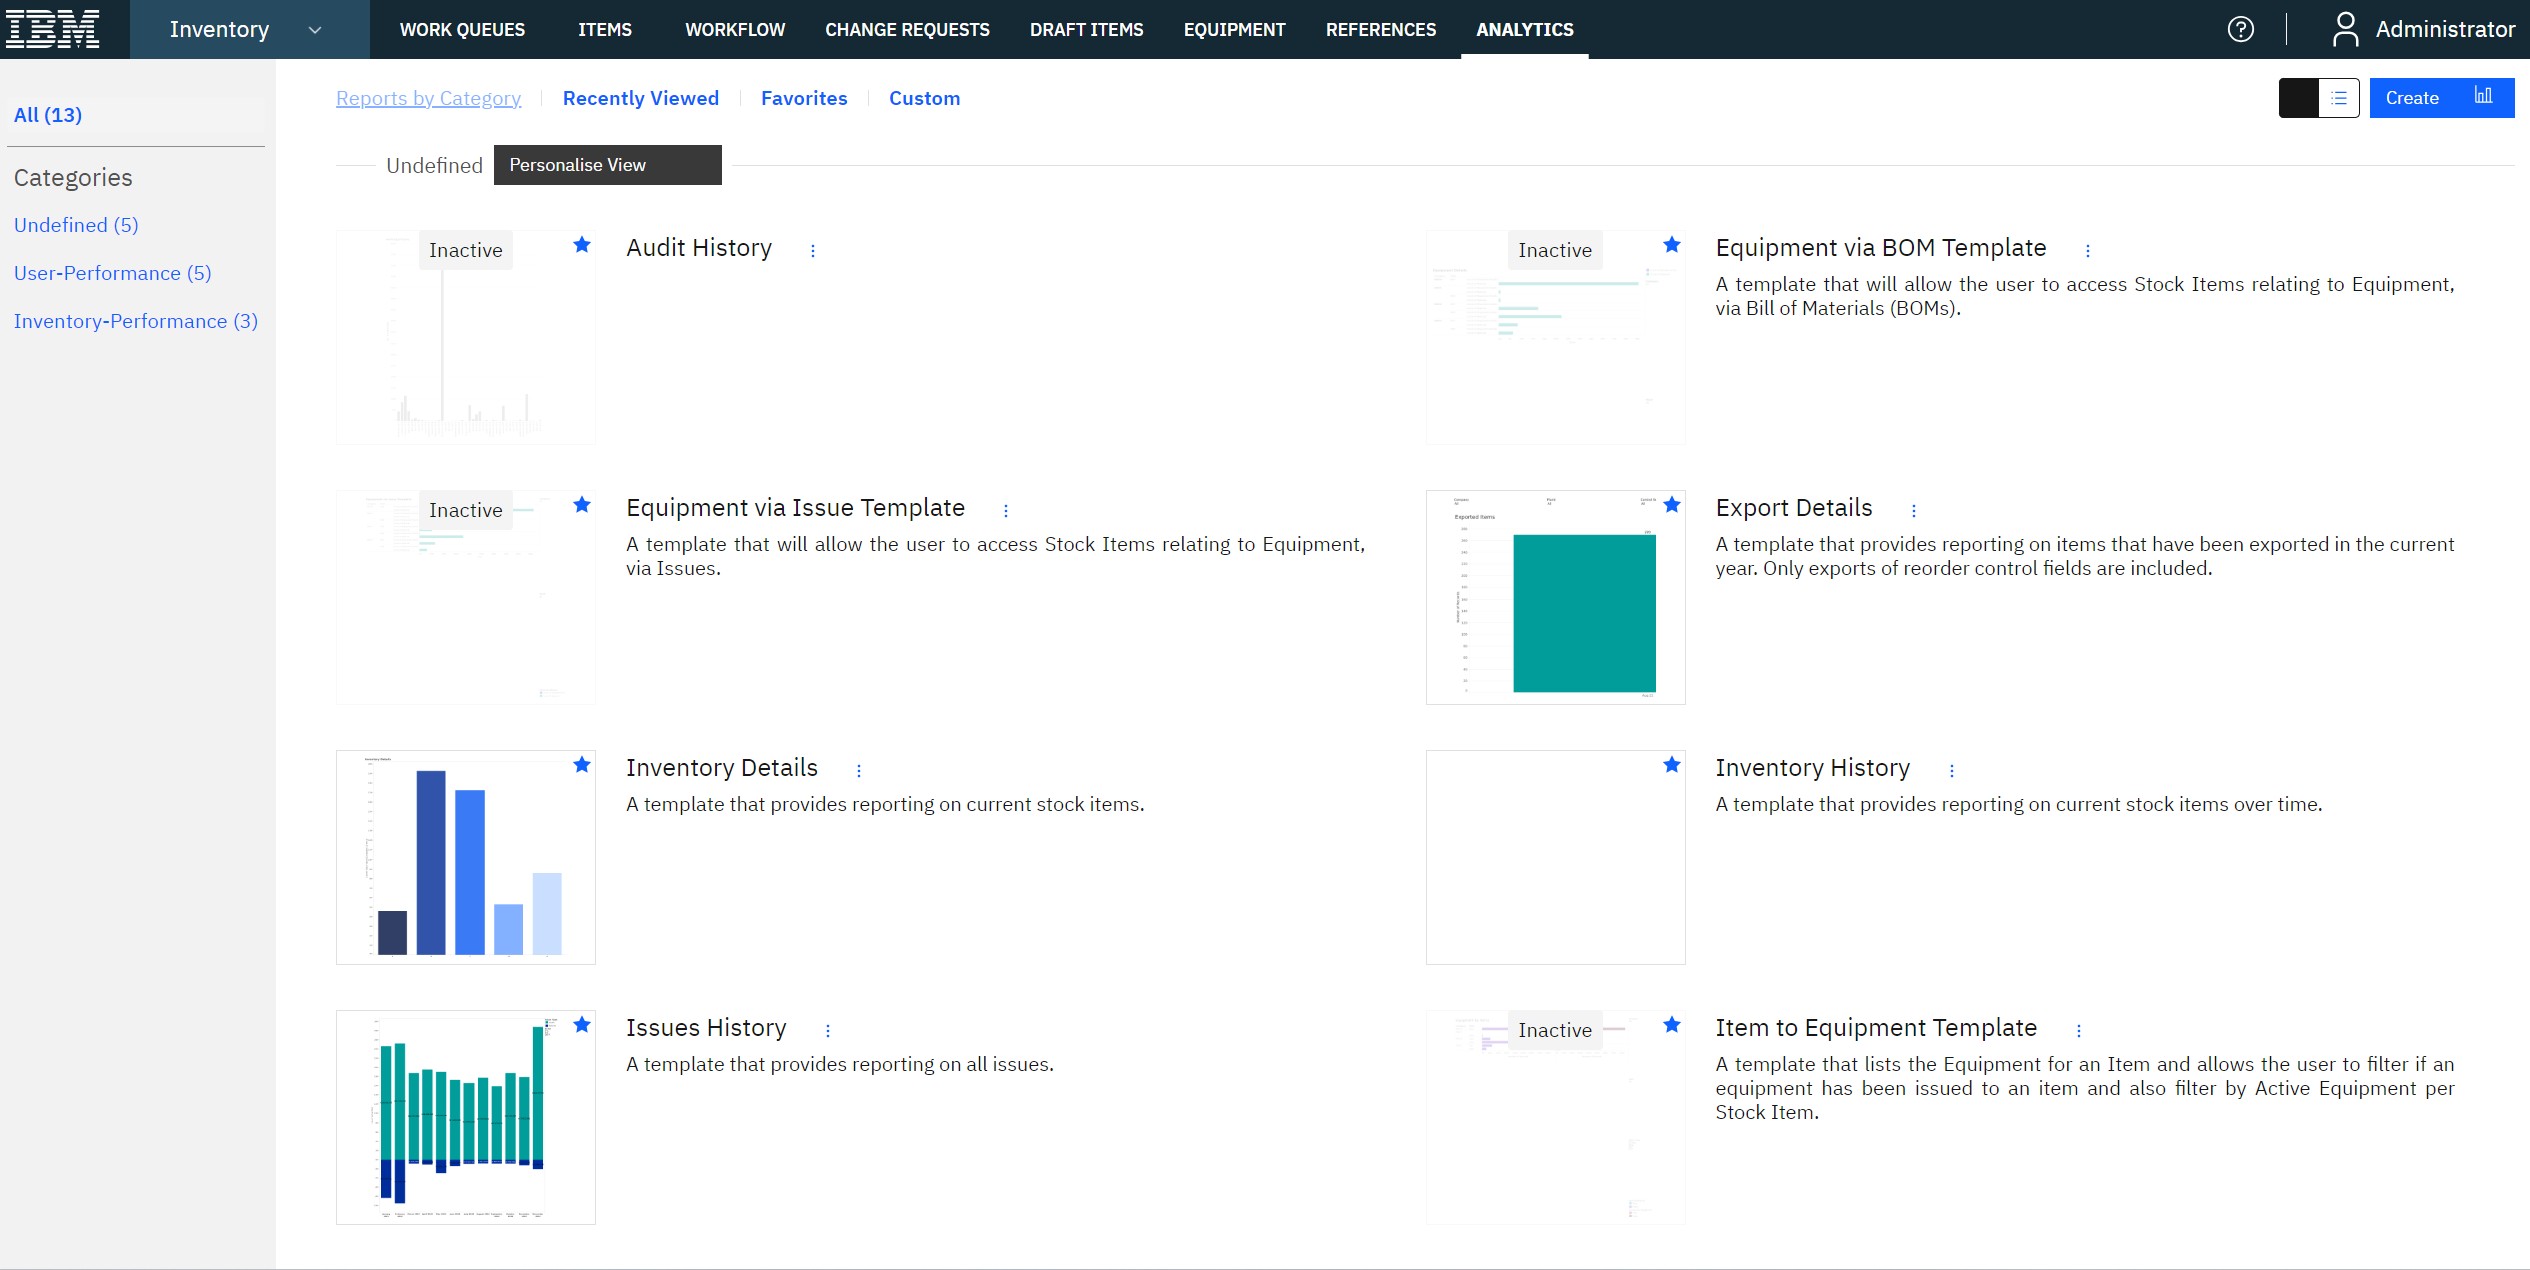
1. Work queues: where the day starts
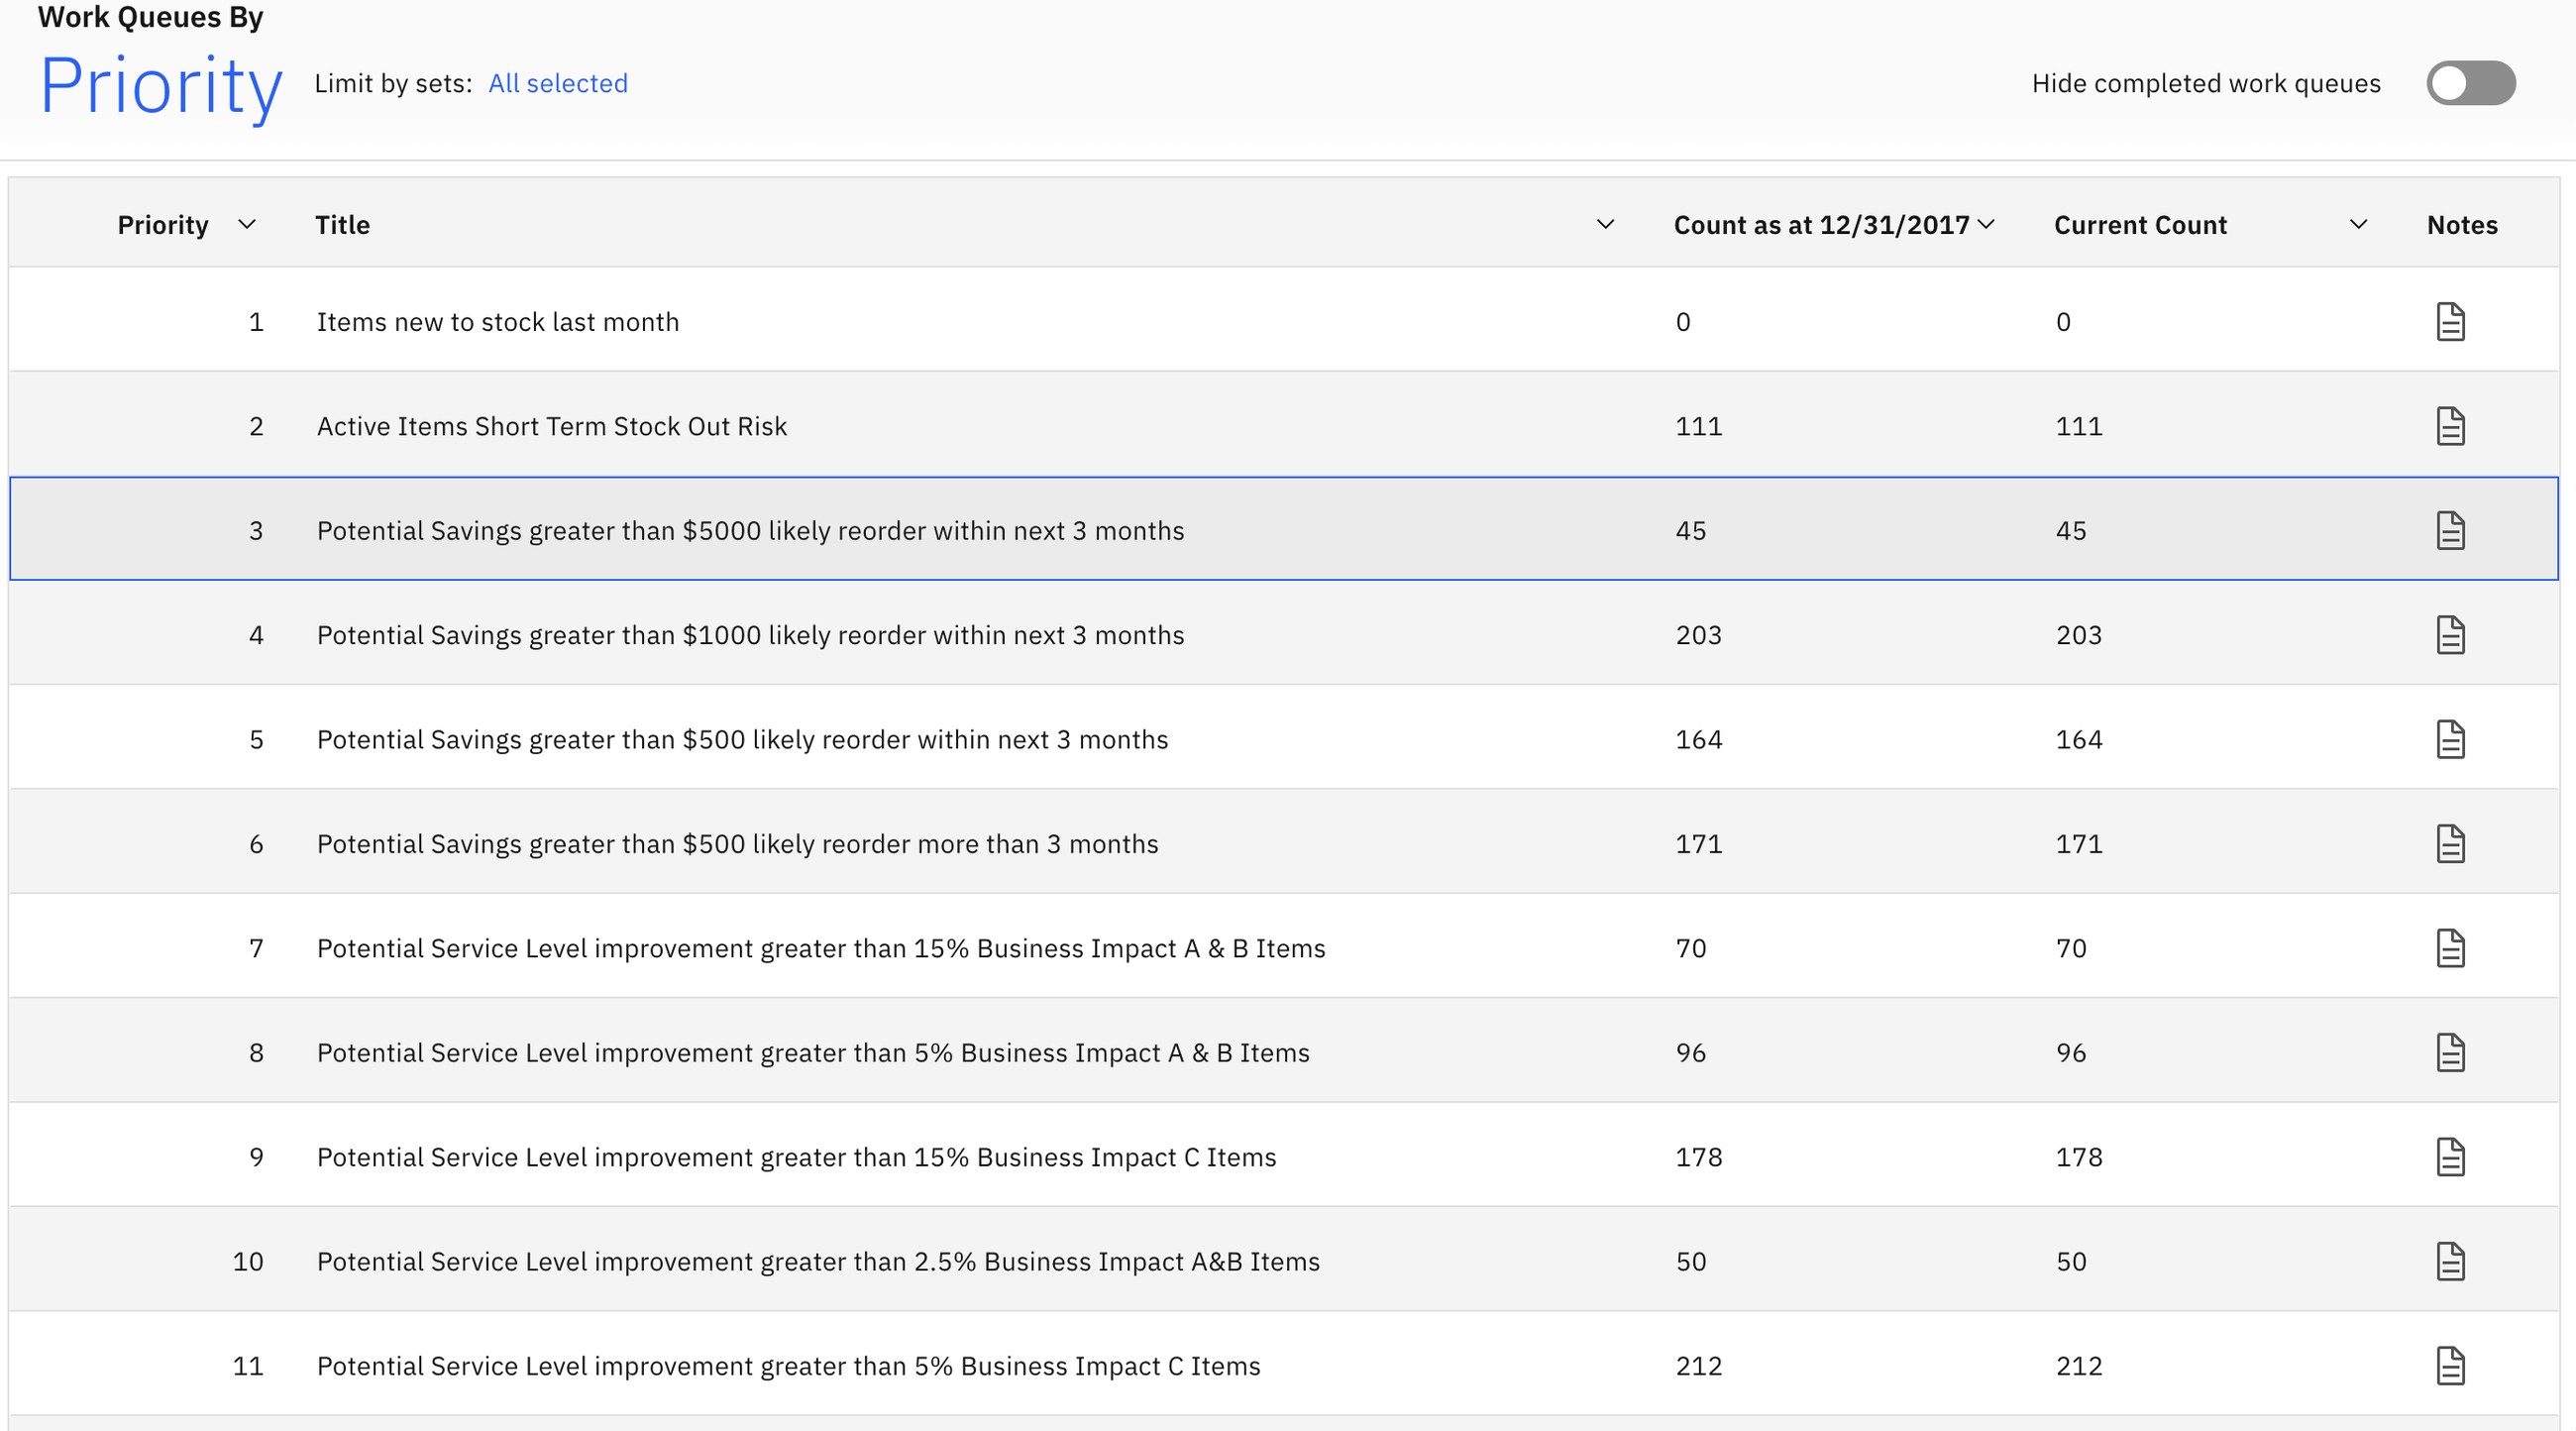
A work queue is a saved rule on any data field: "active items with a short-term stock-out risk", "potential saving above $5,000 and likely to be reordered within three months". The second one matters: if the part is about to be bought again, lowering the level now stops real money leaving. Queues refill themselves as data changes.
2. Item view: one part, the whole story
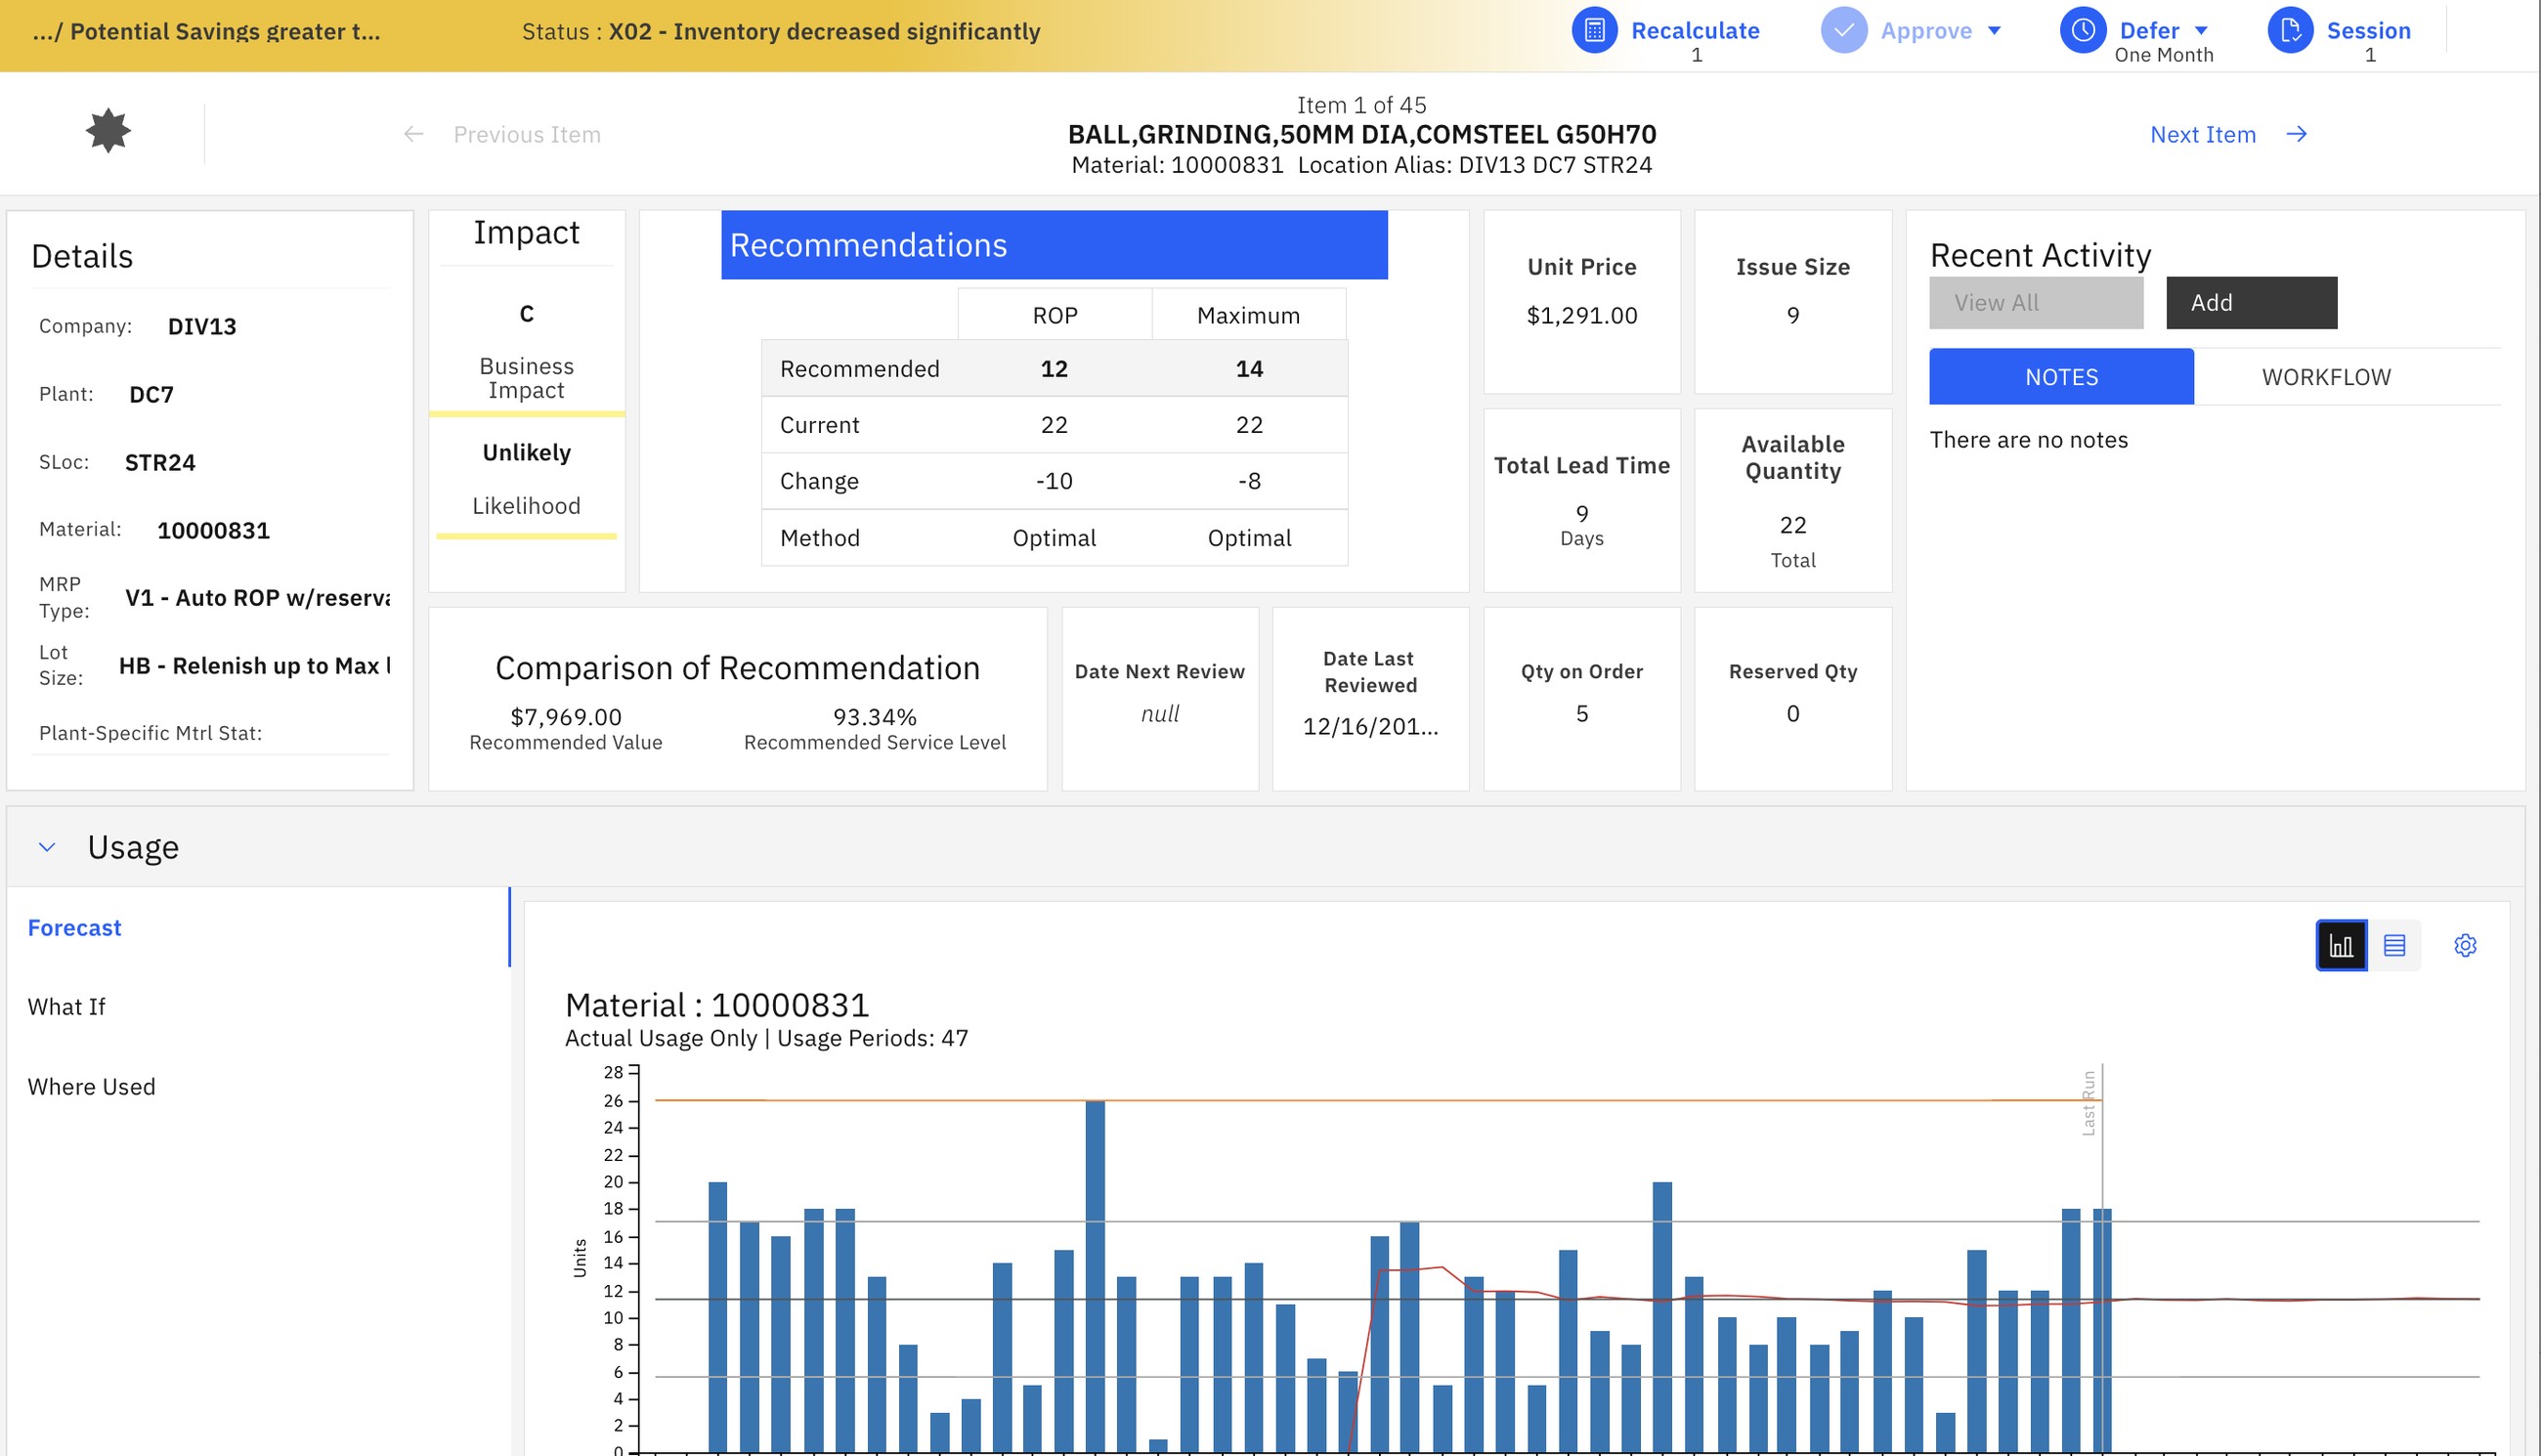
Top right, the recommendation against today's setting. Below, the usage history that explains it, with tabs for the forecast, the what-if model and where the part is used. On the right, the buttons: recalculate, approve, defer.
3. Business impact: how much it hurts
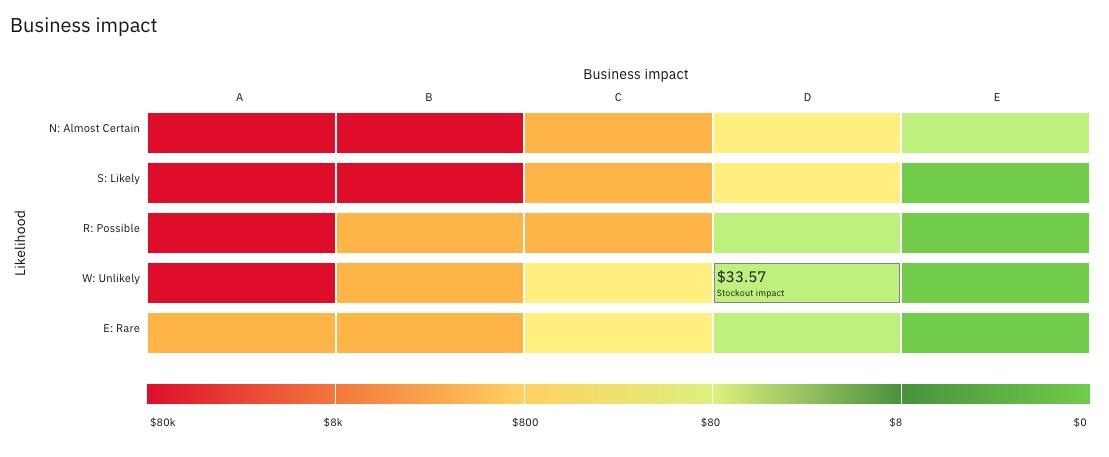
Criticality is not a label in MIO, it is a number. Each combination of impact and likelihood has a cost of being out of stock. That cost is what the optimiser sets against the cost of holding the part.
4. What-if: see the effect before you commit
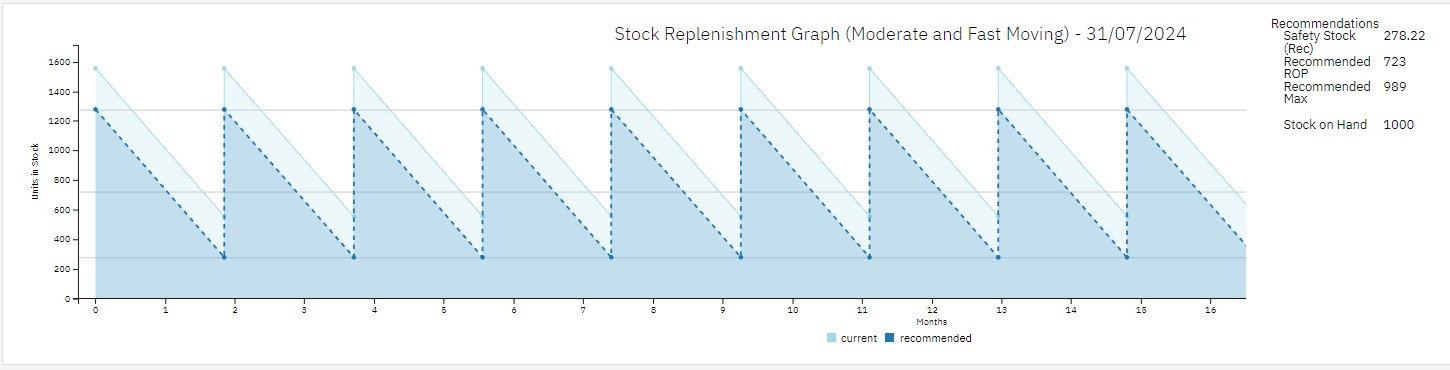
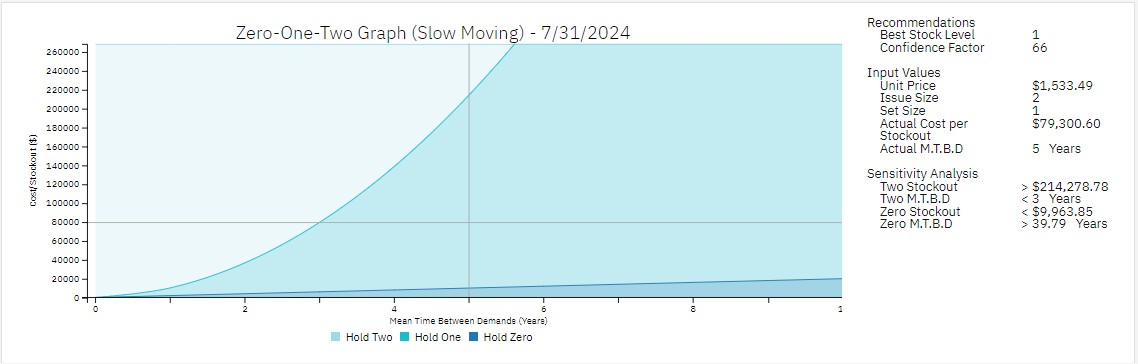
A filter used every week can be forecast like any product. A gearbox used once in five years cannot. For slow movers MIO asks a different question: given the price, the cost of a stock-out and how rarely it is needed, is it cheaper over time to hold zero, one or two? That is the answer maintenance and finance usually argue about without numbers.
The demoEight scenes, eight people
- 1ACritical parts at risk of stock-out
- 1BReducing overstock safely
- 2Finance asks for 10% less inventory
- 3AA critical asset's spare parts
- 3BParts marked 'critical'
- 4Is the criticality right?
- 5Building a bill of materials
- 6Unplanned material consumption
- 7What can be ordered on demand
- 8Supplier lead-time performance
1ACritical parts at risk of stock-out
Saminventory controllerKPIs: stock-out rate, asset uptime
Sam opens his queues on the first Monday of the month. The stock-out queue has grown. He opens it and walks the items one by one.
For each part MIO shows a higher recommended reorder point and maximum. Sam checks why: the usage chart shows demand rising, and the forecast line (chosen by MIO from several forecasting methods, whichever fitted this item's history best) sits above the current level. Then he checks the other half of the risk: lead time.
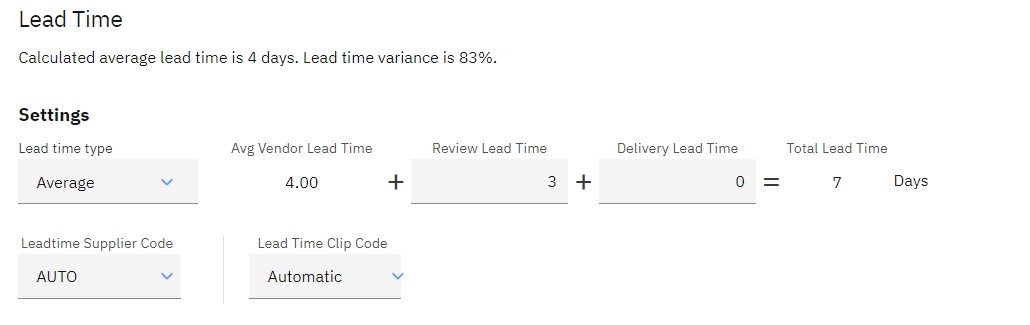
The reorder point must cover what is used while waiting for the delivery. If the supplier takes 4 days on average but varies by 83%, some deliveries take 7. A level set for 4 days runs dry on the bad ones. MIO measures the real lead time from receipts instead of trusting the contract.
Sam accepts. Inside his authority the new levels are exported to the EAM; above it they go for approval.
How to say it: "When did someone last review your minimum and maximum levels, and was it before or after your supplier's delivery times changed?"
1BReducing overstock safely
Saminventory controllerKPIs: carrying cost, working capital
Next queue: savings above $5,000. Same screen, opposite direction. The grinding ball above is set at 22 and MIO recommends 12. Before accepting, Sam opens the comparison.
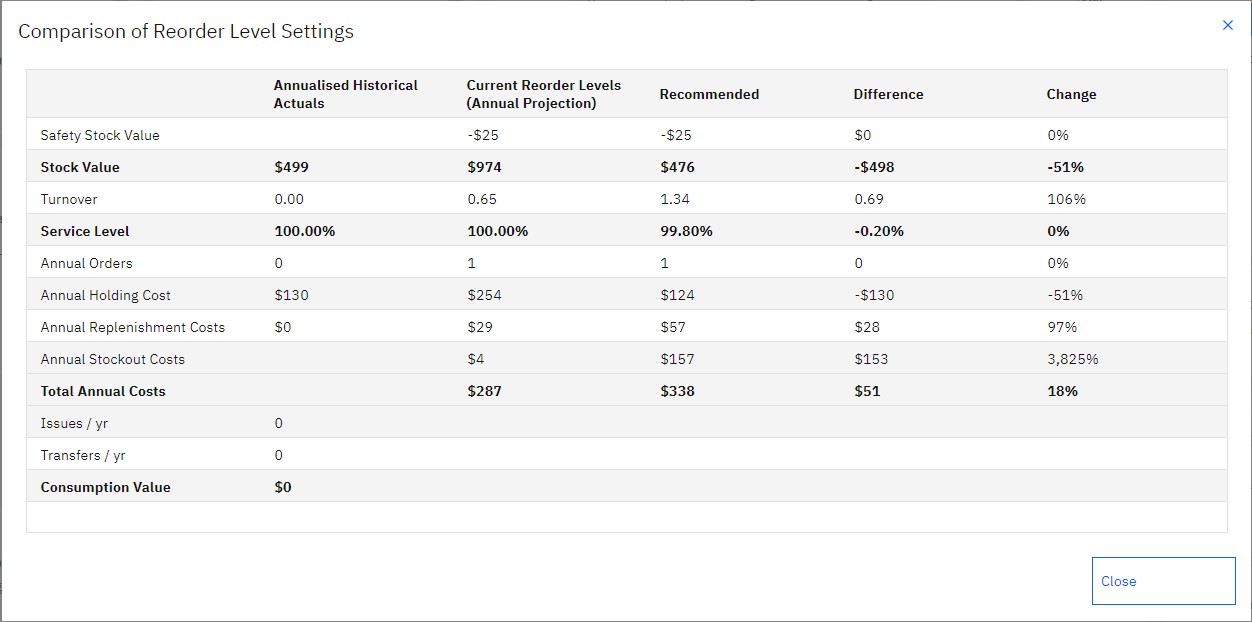
Stock value $974 → $476 (−51%). Turnover 0.65 → 1.34. Service level 100% → 99.80%. Holding cost $254 → $124 a year. The table also shows what gets worse: the stock-out cost rises. MIO does not hide the trade; it prices it.
How to say it: "If I asked you to take 10% out of the storeroom tomorrow, which parts would you cut, and what would happen to availability? Would you know before or after?"
2Finance asks for 10% less inventory
Jenniferfinance managerSamKPIs: working capital, cash flow
Jennifer needs 10% out of inventory this year. Sam does not negotiate; he measures.
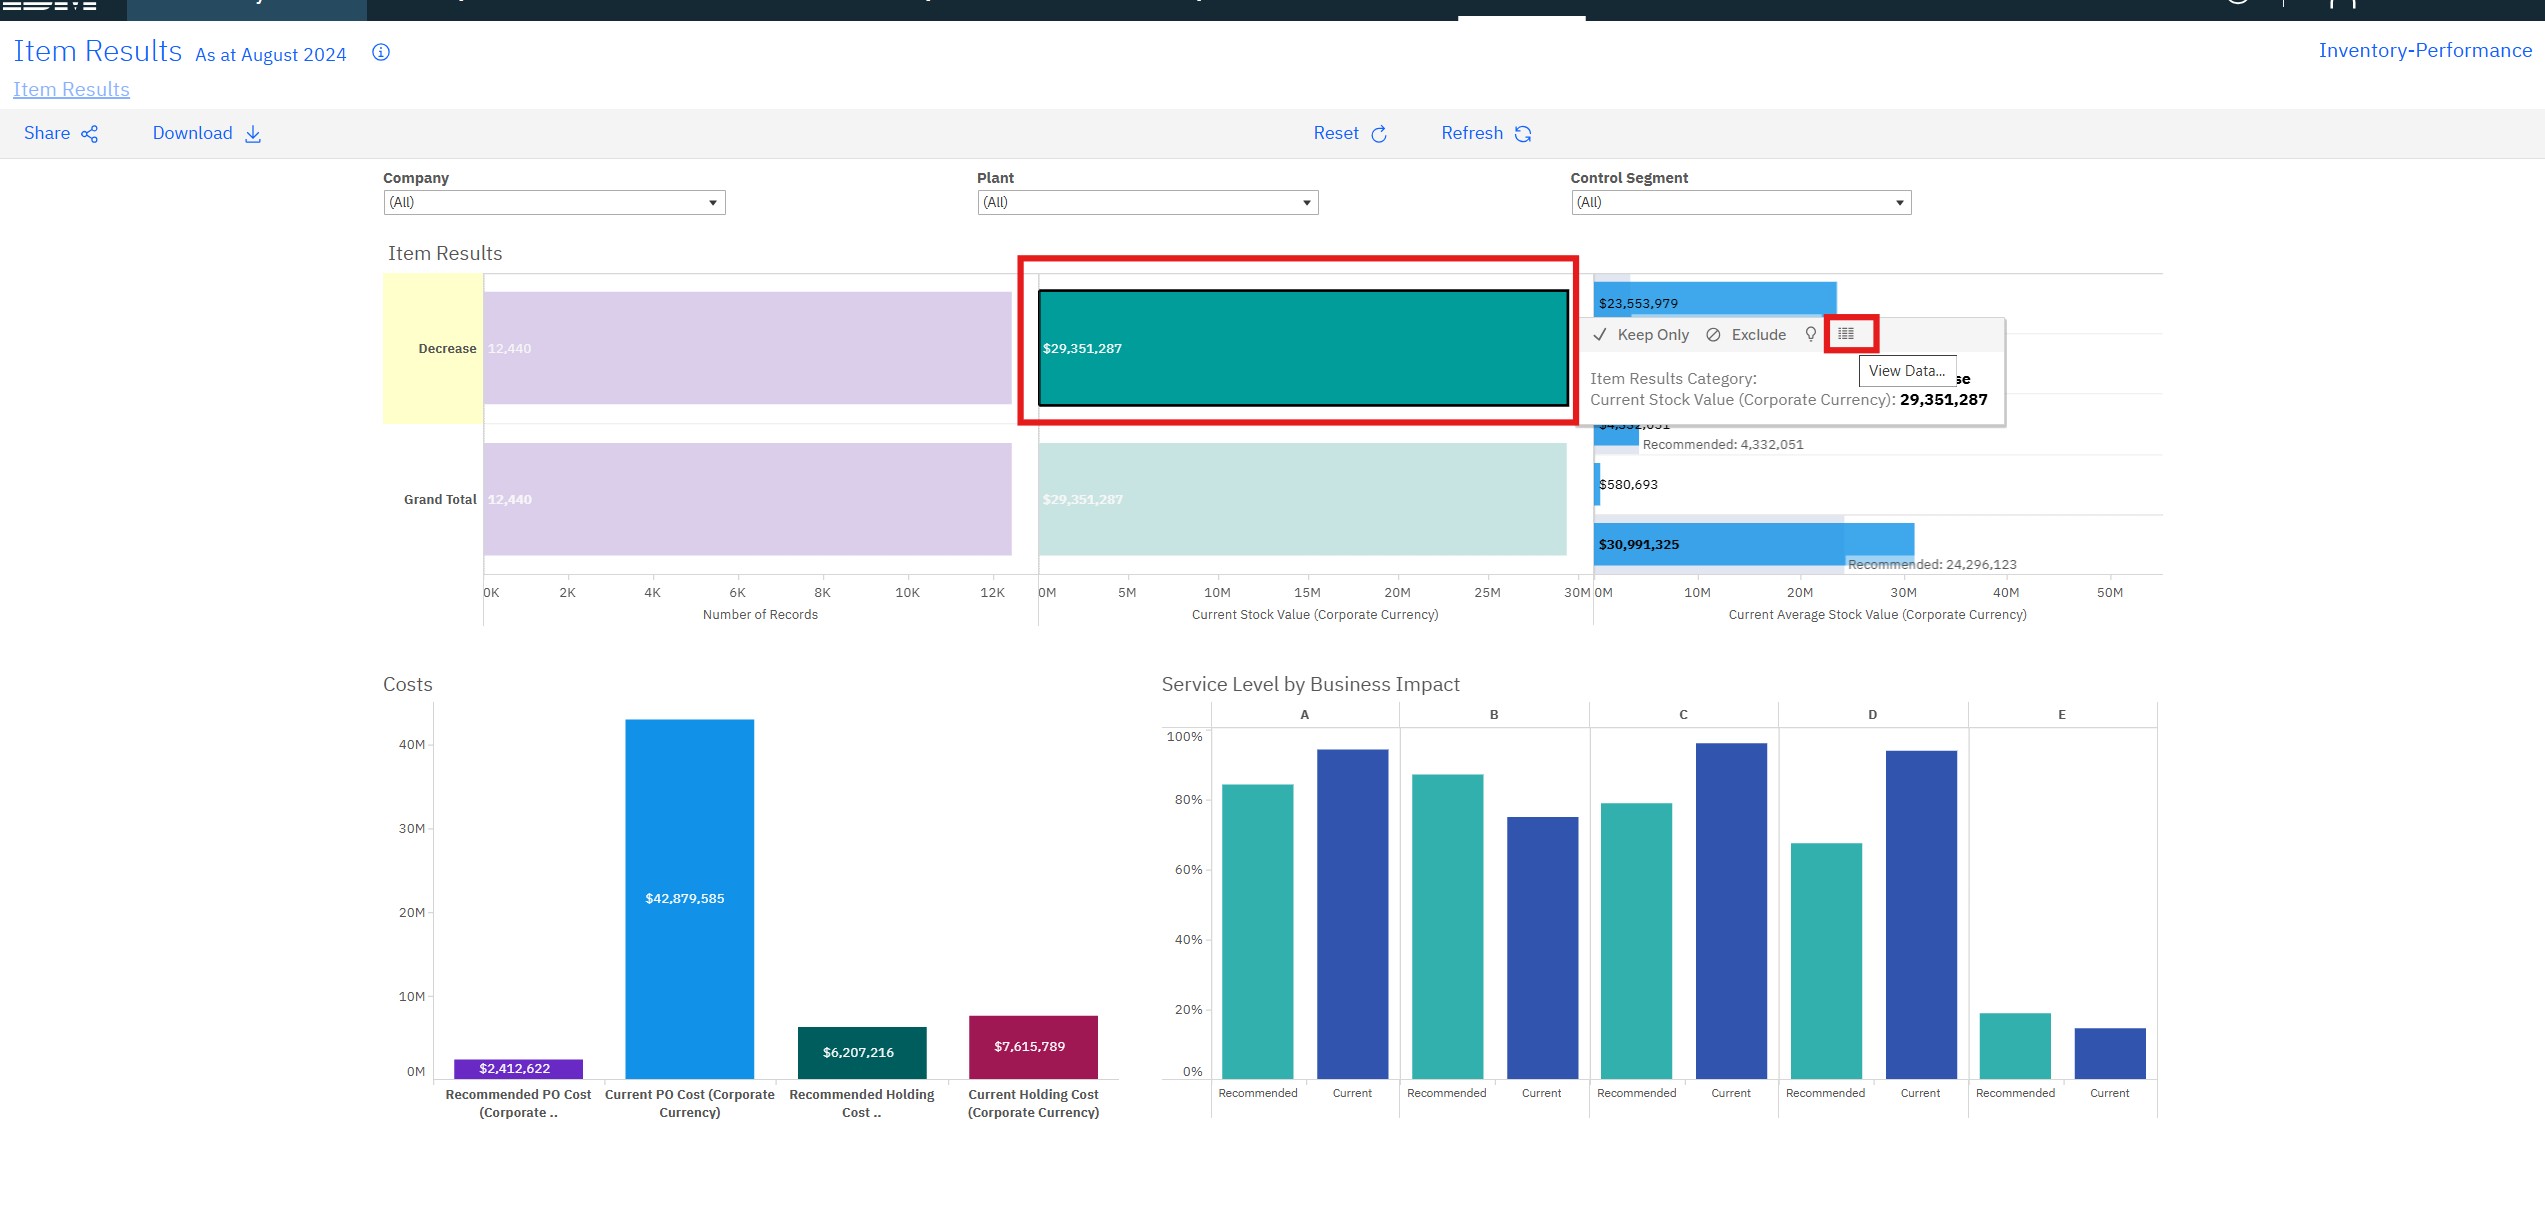
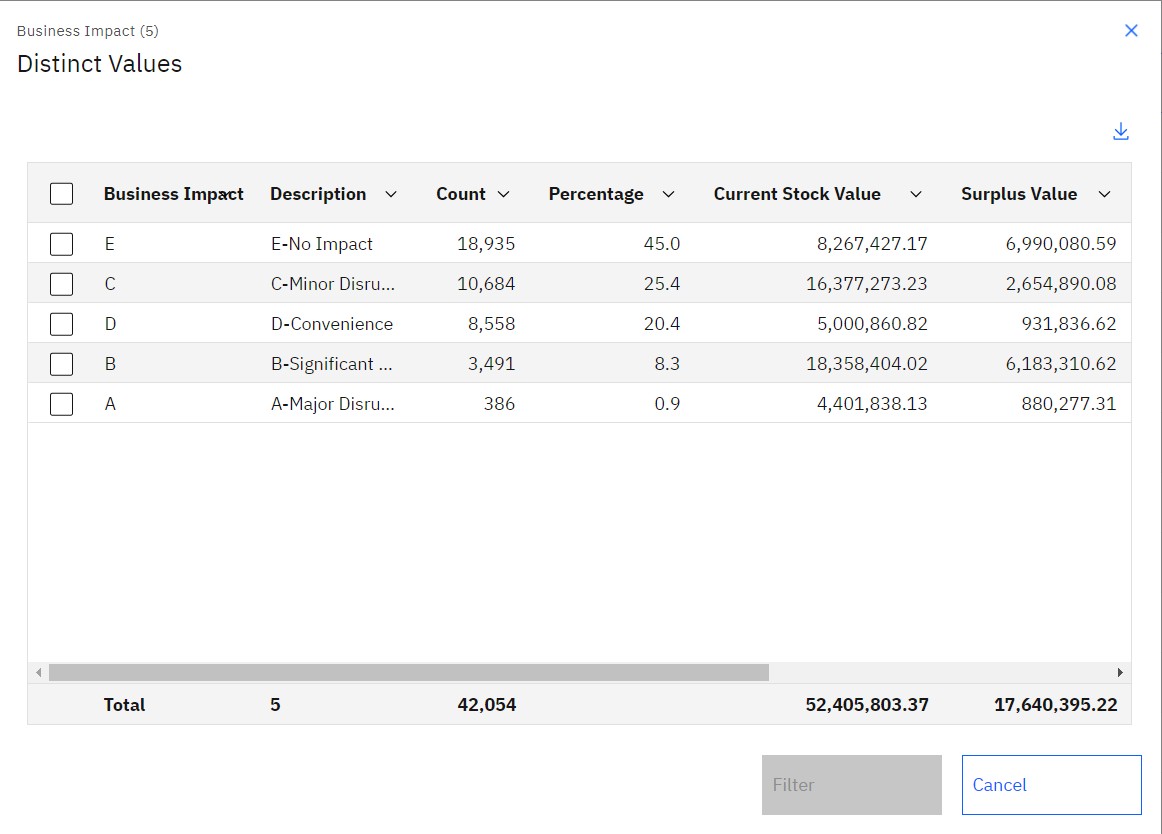
Target: 10% of $52.4M = $5.2M. Surplus that MIO has already identified: $17.6M. On items with no business impact (E): $7.0M. Sam can meet the target from parts whose absence hurts nobody, and show finance the service level before and after.
He applies a saved filter, reads the totals, and sends the list as a bulk change.
How to say it: "Finance will ask for a reduction sooner or later. Do you want to choose the parts, or have the cut applied evenly across the storeroom?"
3AA critical asset's spare parts
Ashishmaintenance managerKPIs: asset uptime, MTBF
Ashish is responsible for a crusher. He does not think in item numbers; he thinks in assets. MIO has the equipment register too.
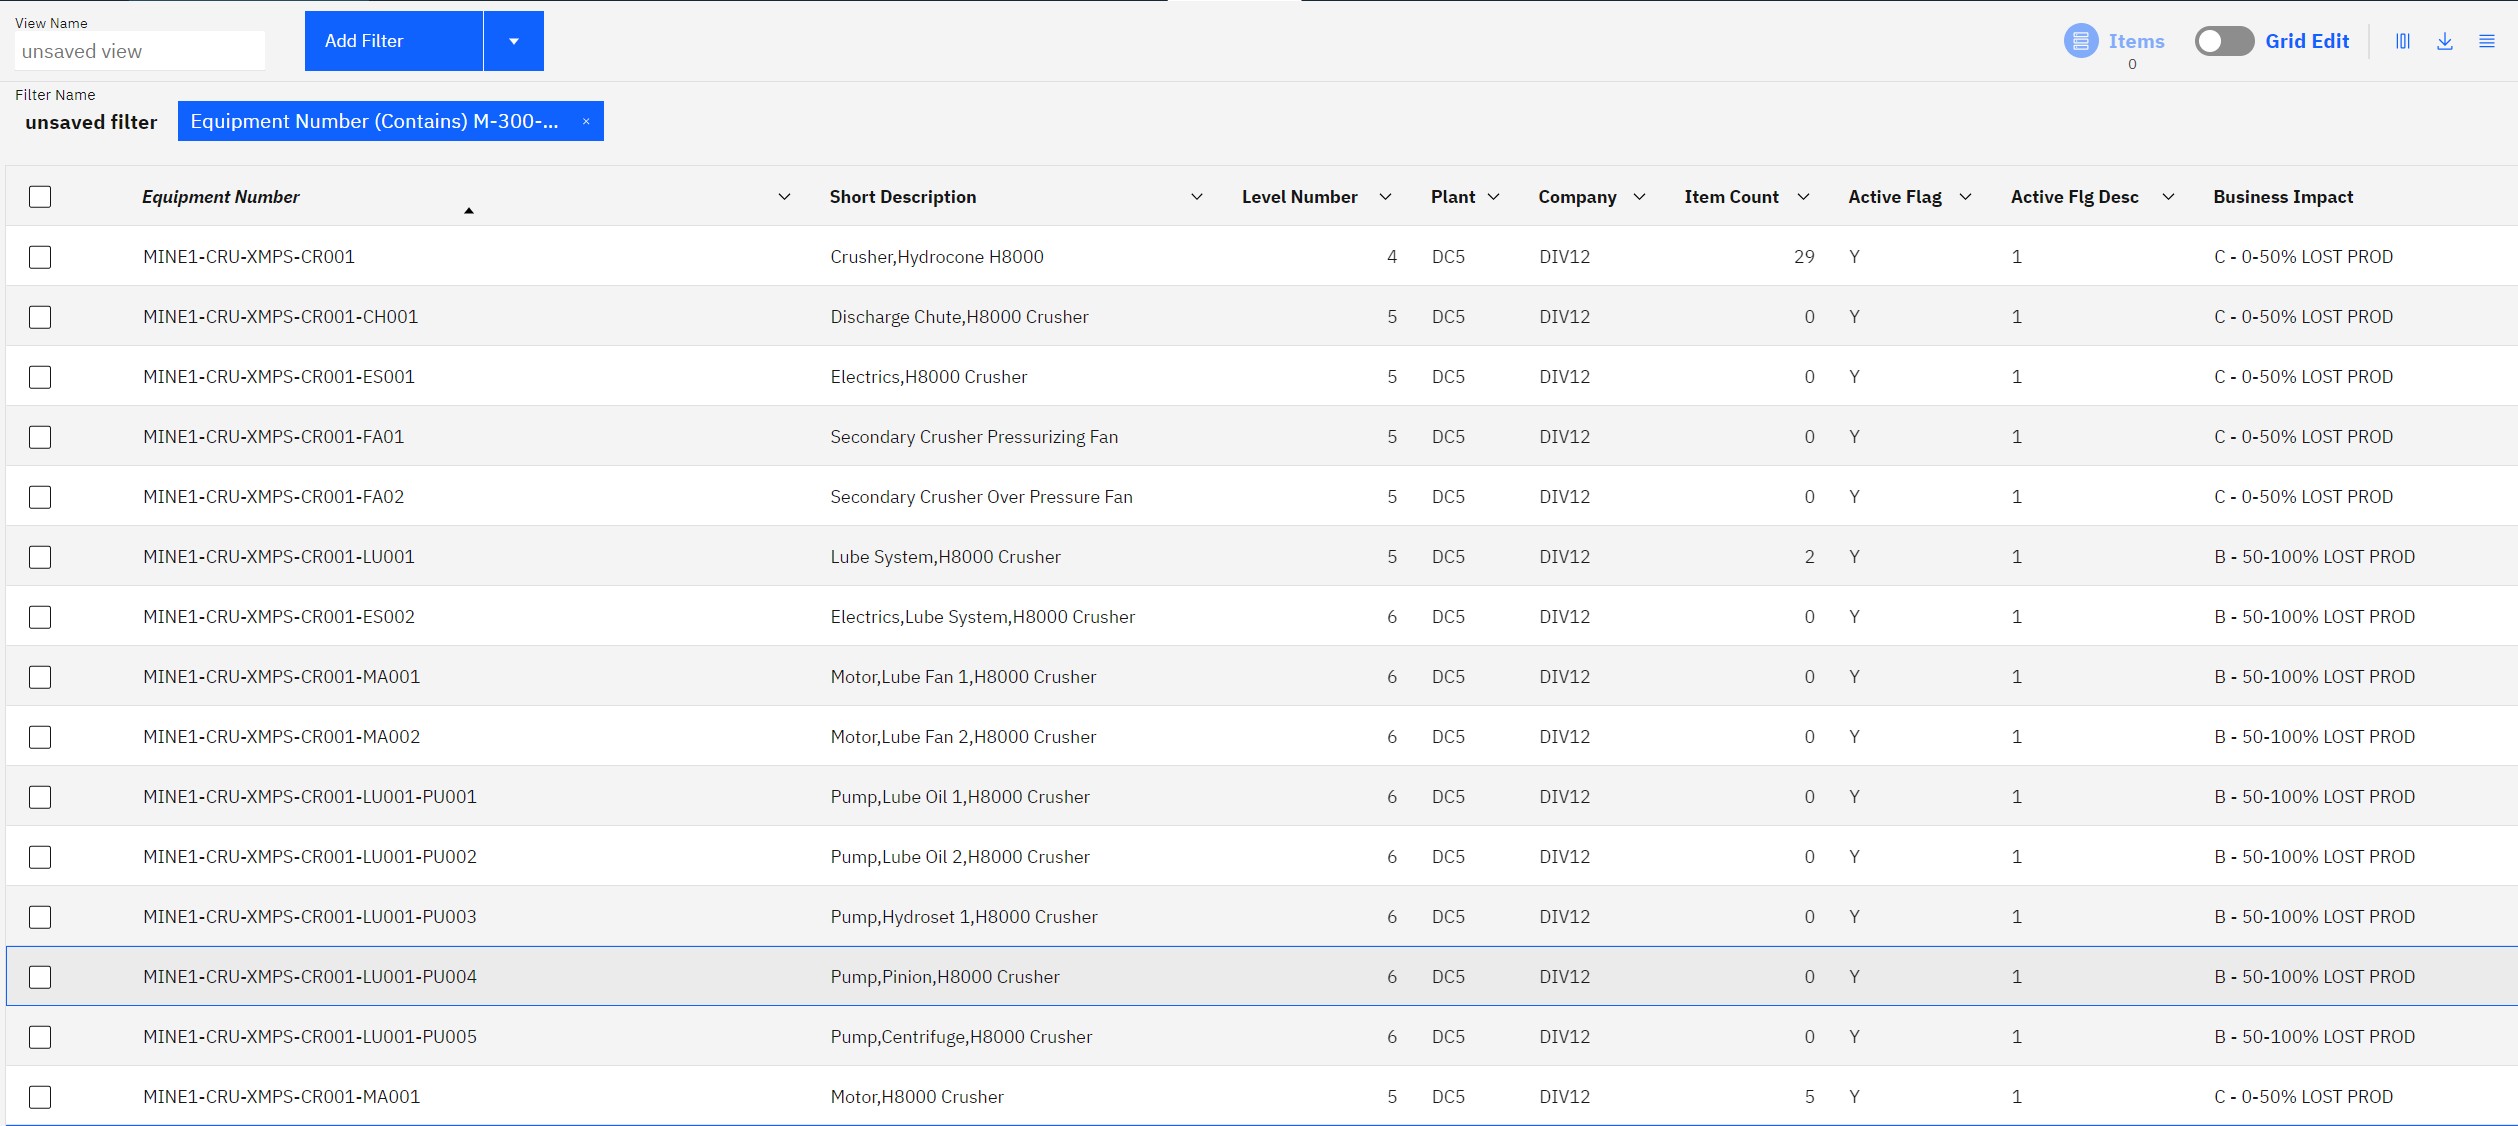
He filters on the asset, lists its materials, opens one in the item view, and finds a part rated C on an asset that stops half the plant. He raises its business impact, recalculates, and the recommended reorder level moves with it. The change is above his authority, so it goes to workflow.

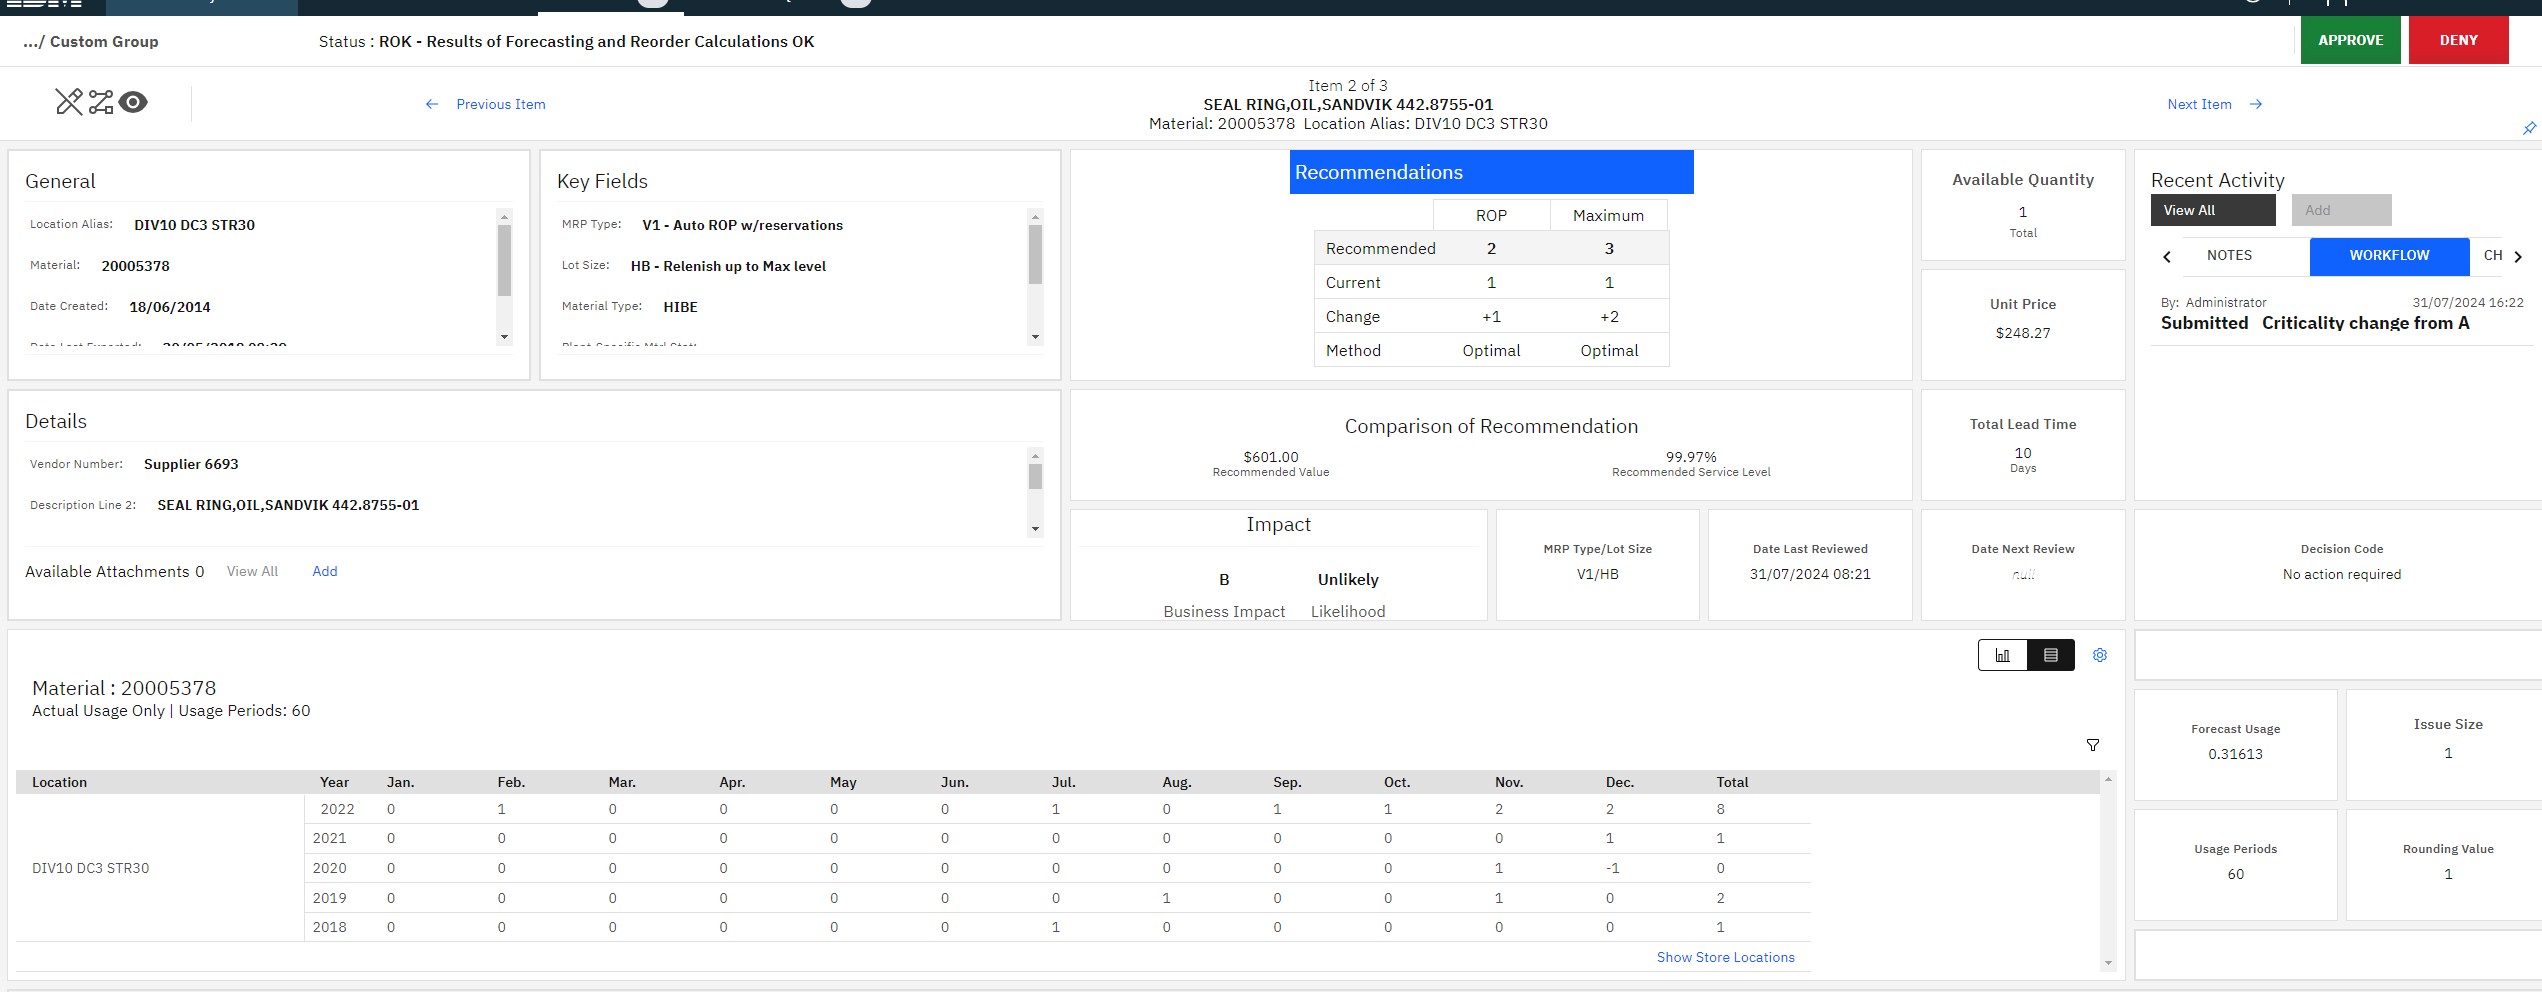
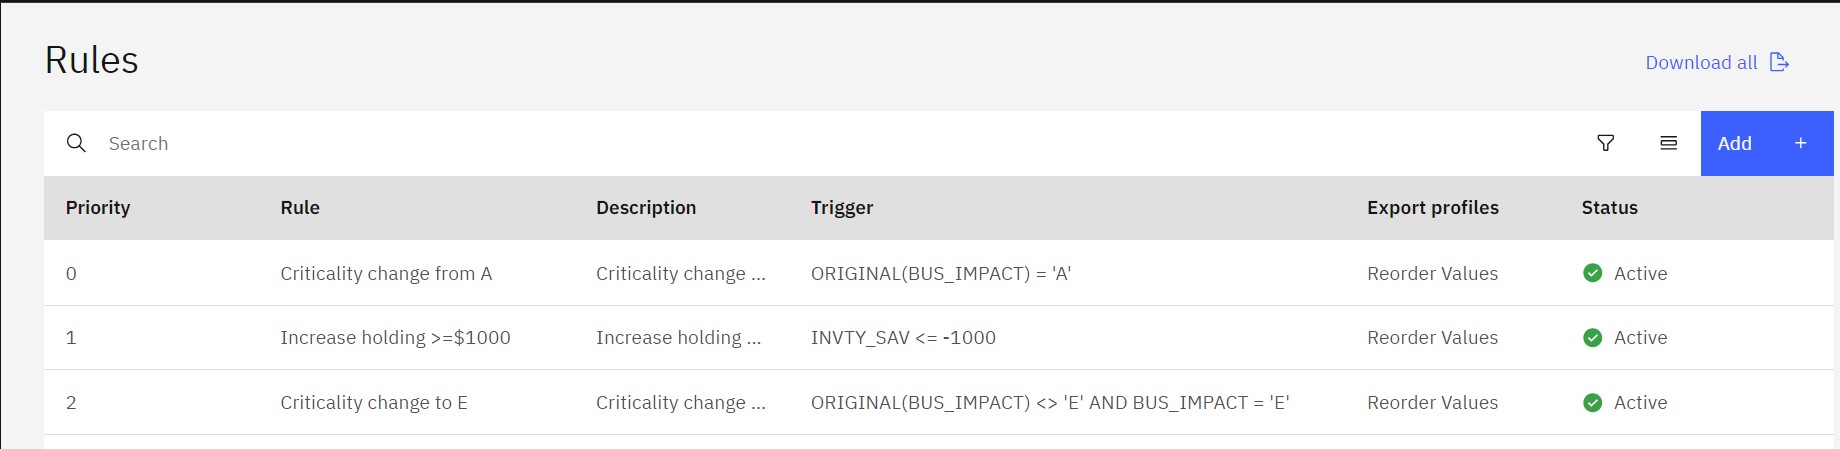
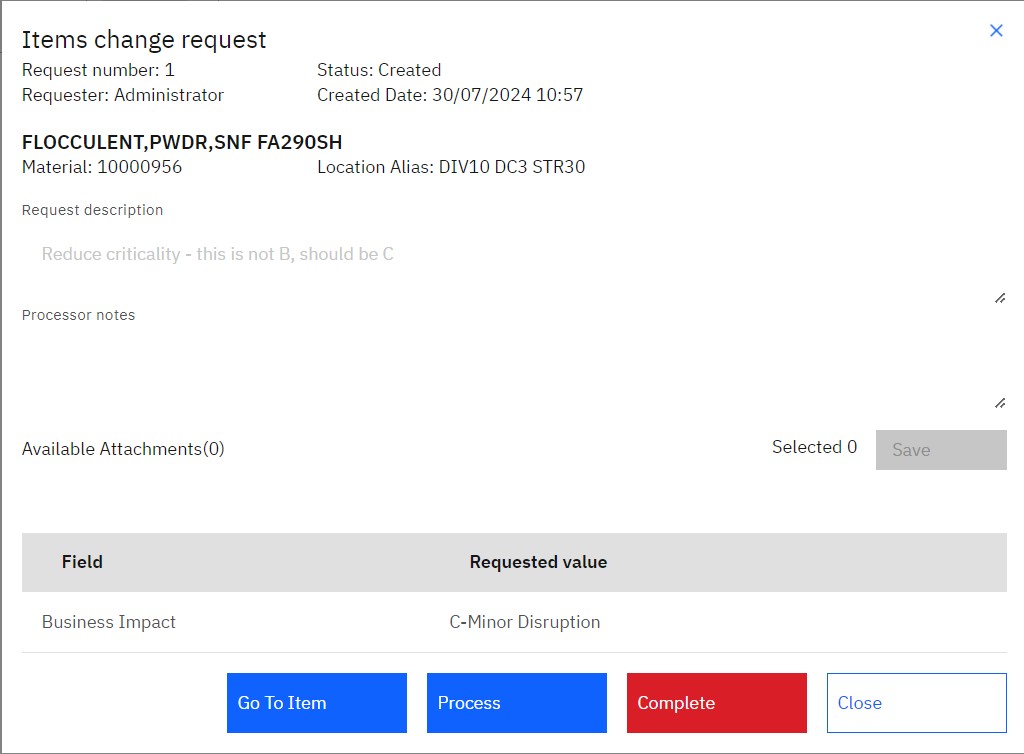
Who may change what is a rule, not an email. Each request shows before and after, the approvers in order, their notes, and stays on record.
3BParts marked 'critical'
Ashishmaintenance managerKPIs: holding cost, asset reliability
The opposite check. Over the years, hundreds of parts were marked critical "to be safe". Are they protected, and do they all deserve it?
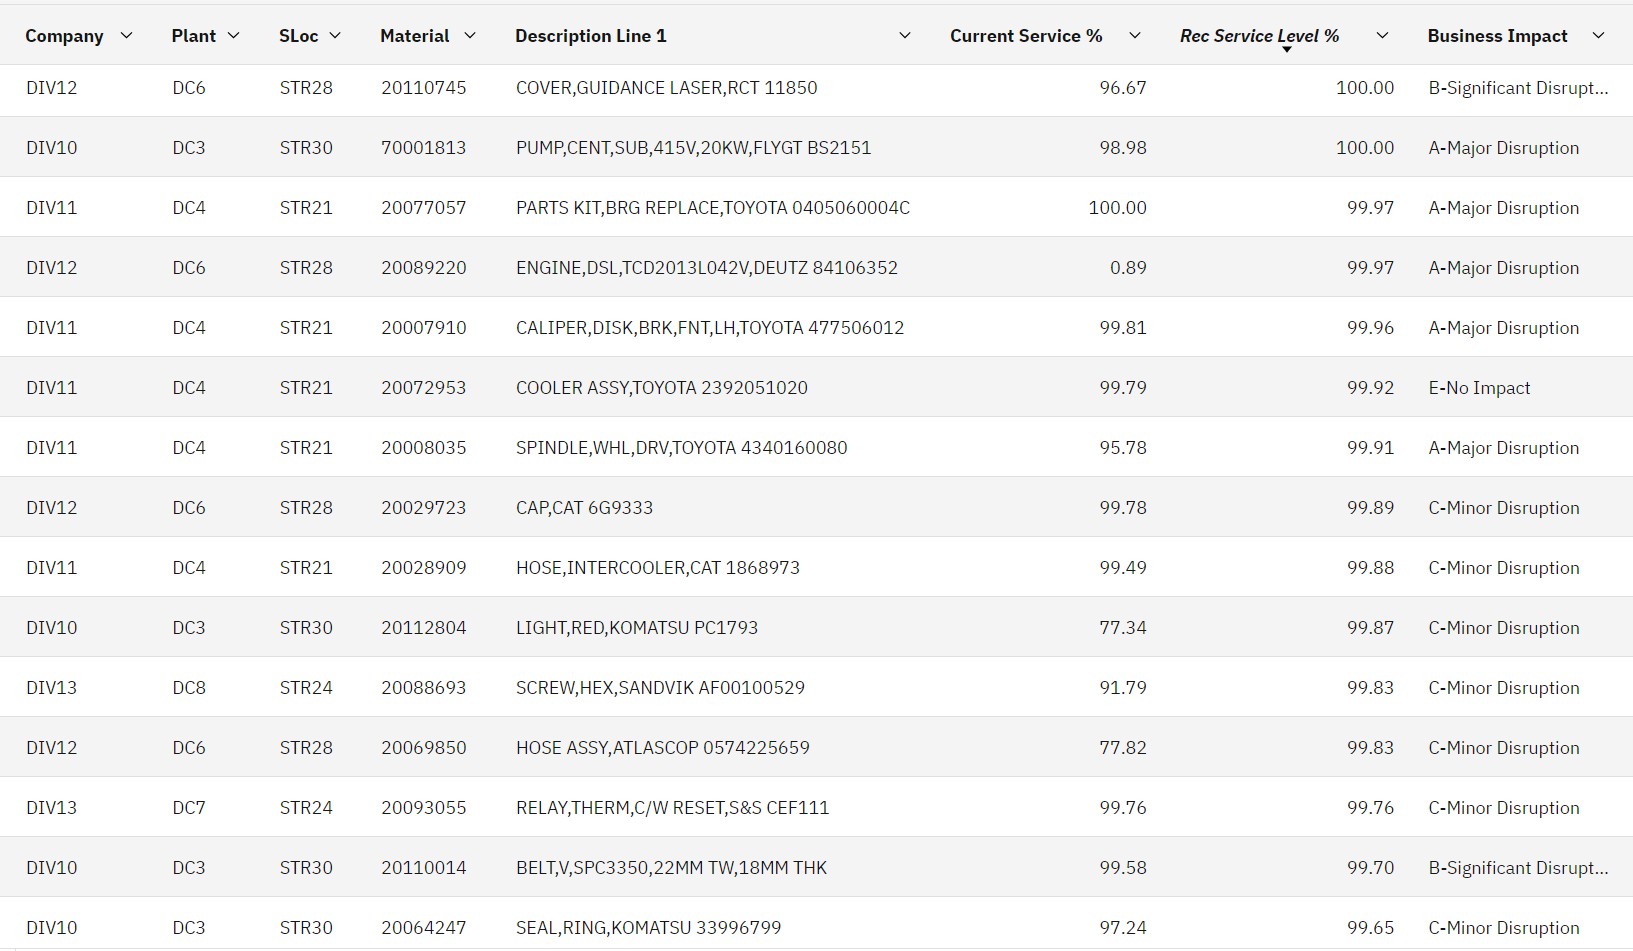
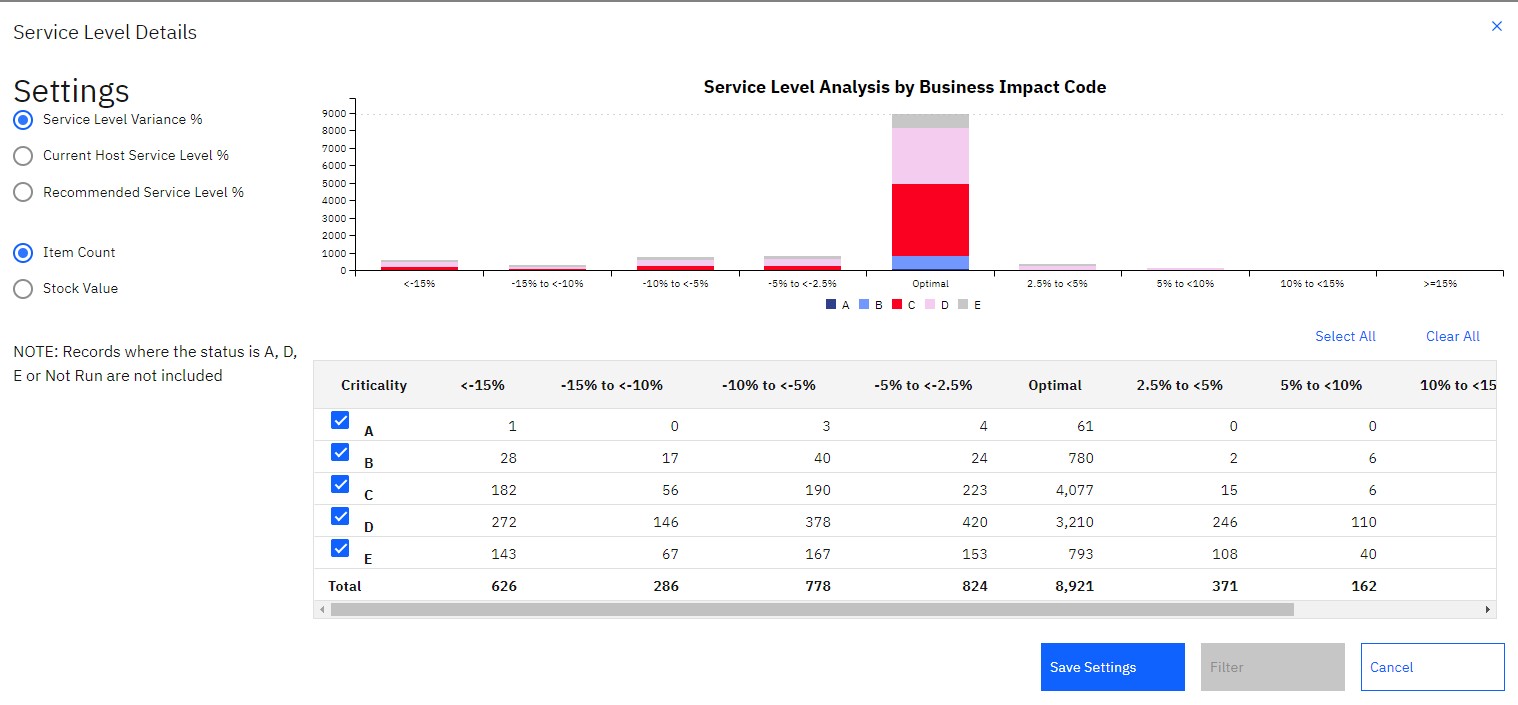
Ashish finds A-rated parts far below their target (a risk) and low-impact parts far above (money). He selects the group, edits them in bulk in the grid, recalculates and sends for approval.
How to say it: "A 100% service level on every part is neither affordable nor needed. Which parts must never be missing, and are those the ones you are actually protecting?"
4Is the criticality right?
Loriasset managerKPIs: inventory accuracy, planning efficiency
Lori owns asset criticality. Inventory criticality was set years ago by someone else. Do the two agree?
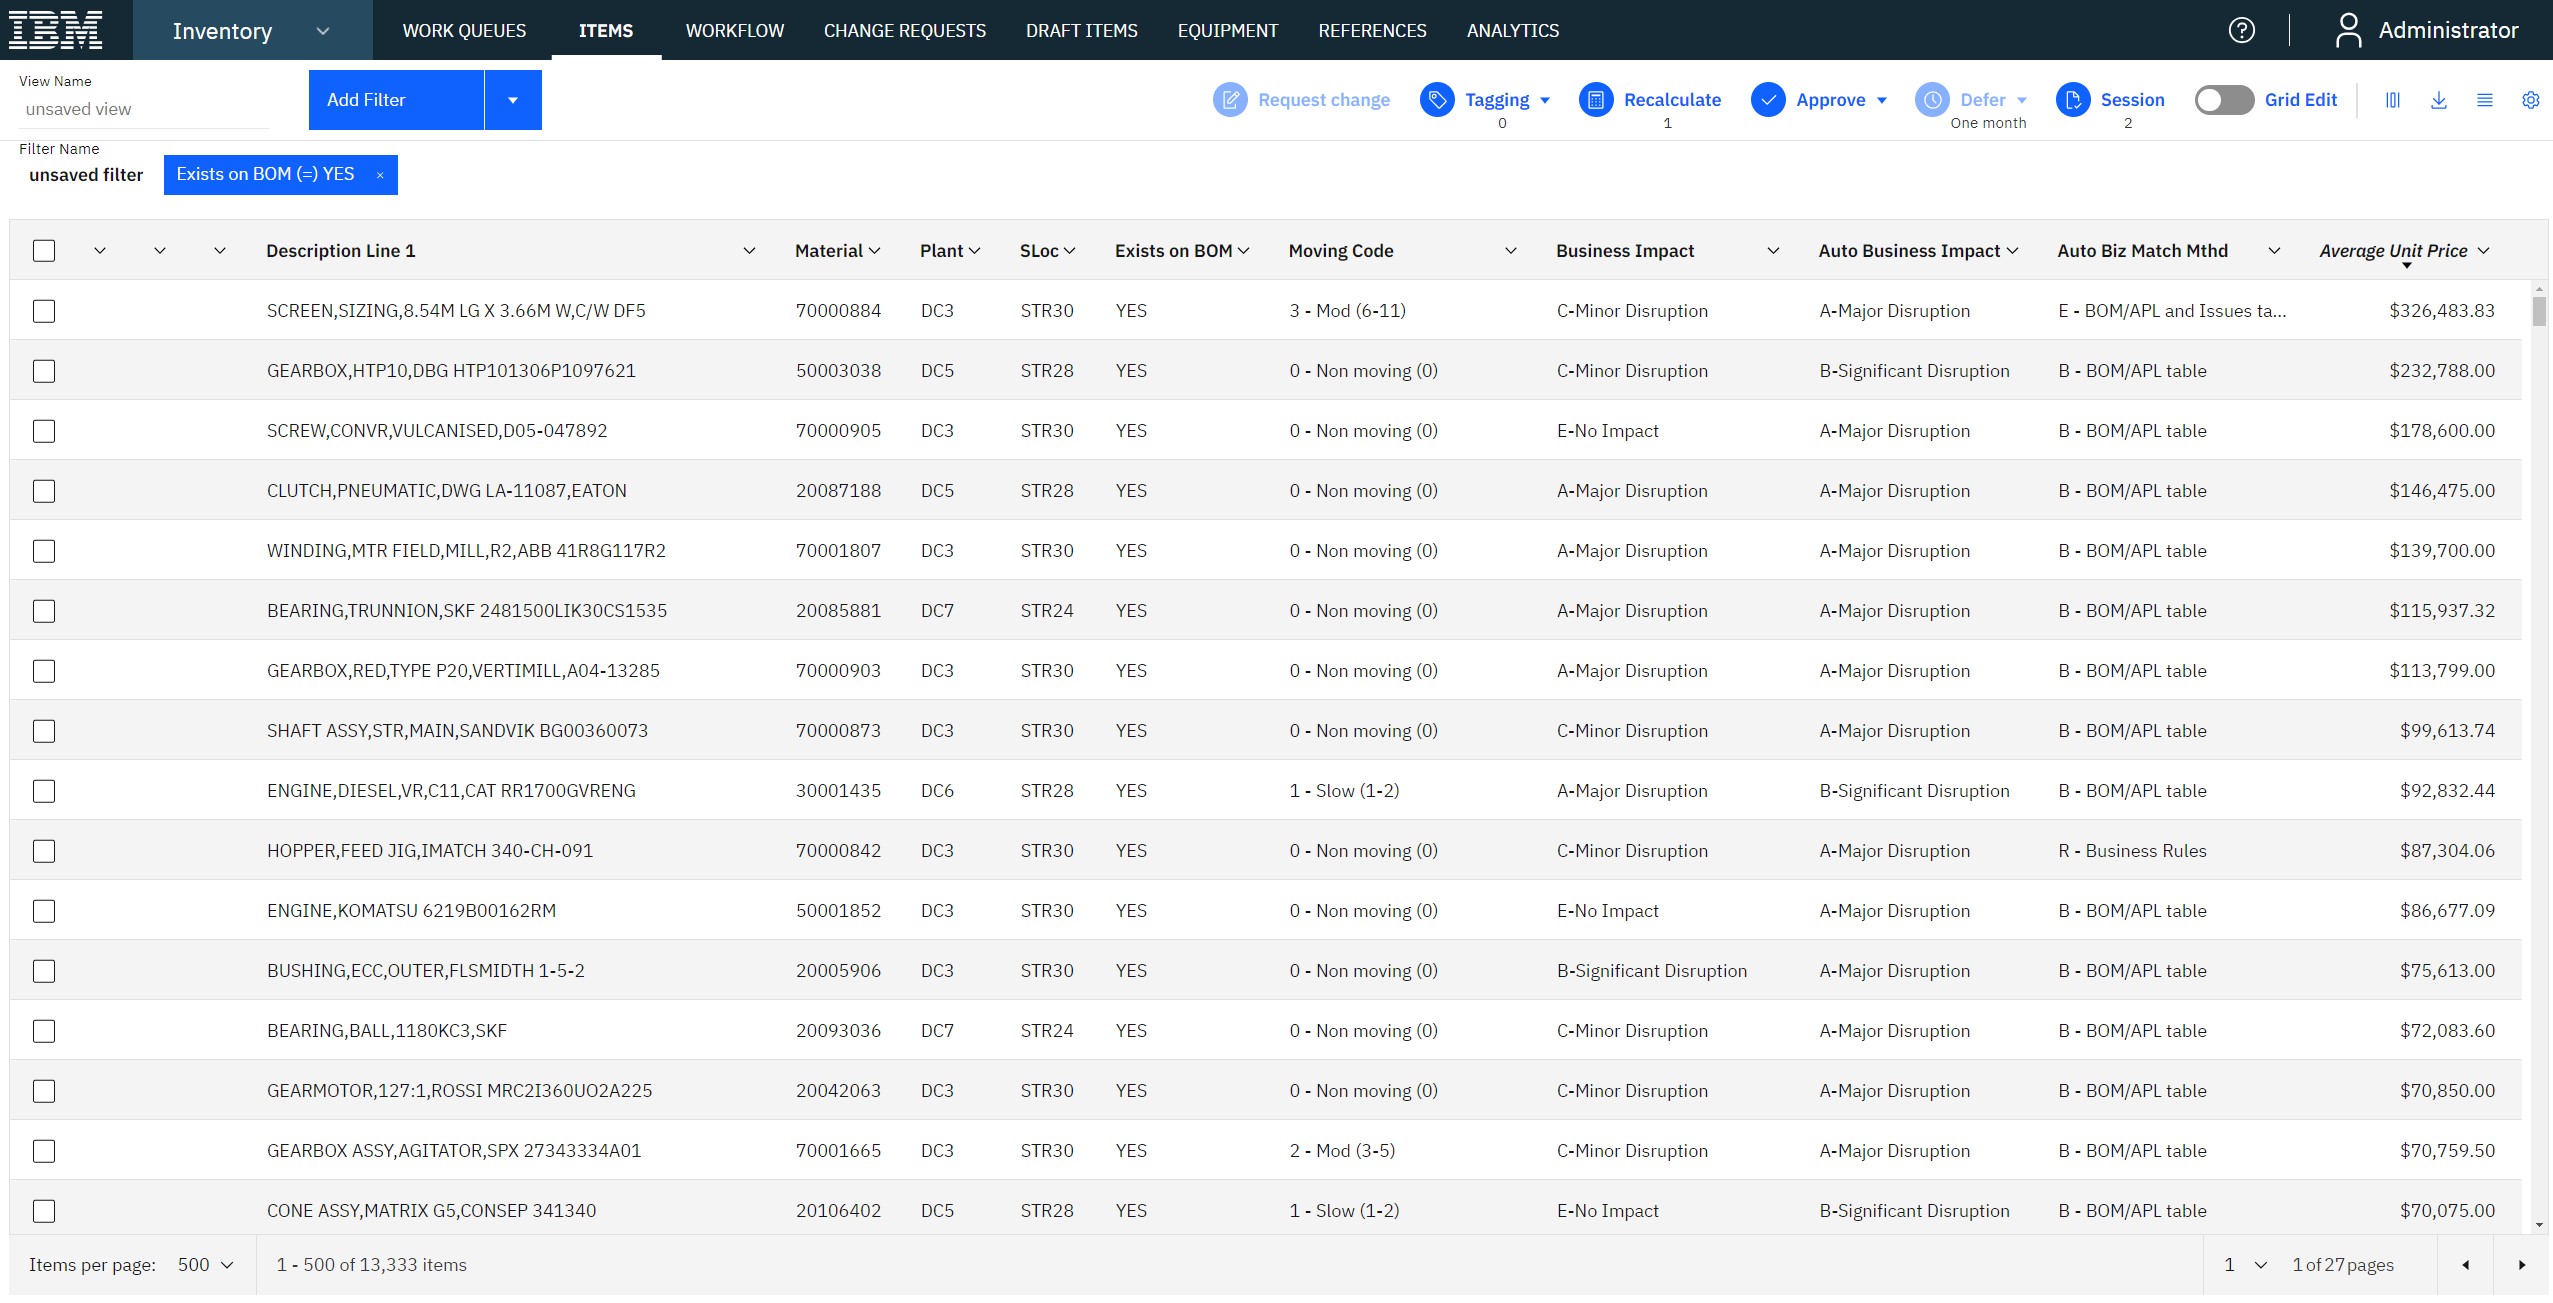
MIO works out a recommended criticality for each part from where it is used: the criticality of the assets on its bill of materials, the work orders it was issued to, and rules on material type, single sourcing or long lead time. In the first row, a sizing screen rated "C, minor disruption" is recommended as "A, major disruption" because of the bill of materials it sits on.
This is the bridge between asset management and the storeroom. Once the rules are set, criticality maintains itself as assets and bills of materials change.
5Building a bill of materials
Evemaster data controllerKPIs: data accuracy
Many assets have no bill of materials, or a wrong one. Eve has to build it. The evidence is already in the issue history: what was actually taken from the store for this asset.
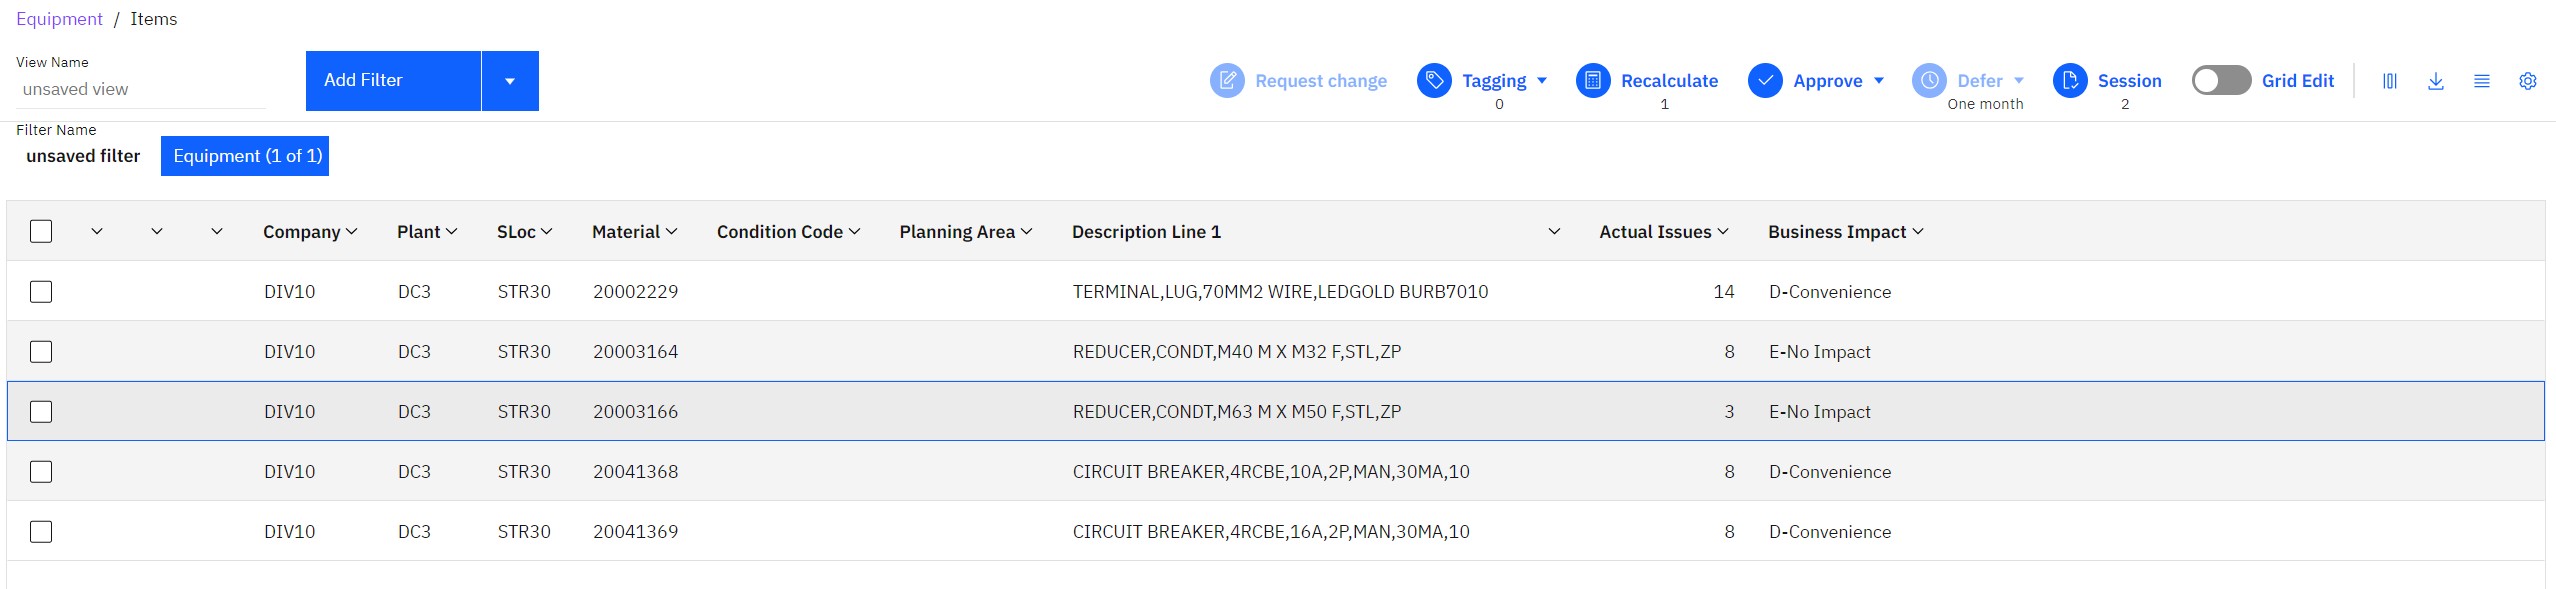
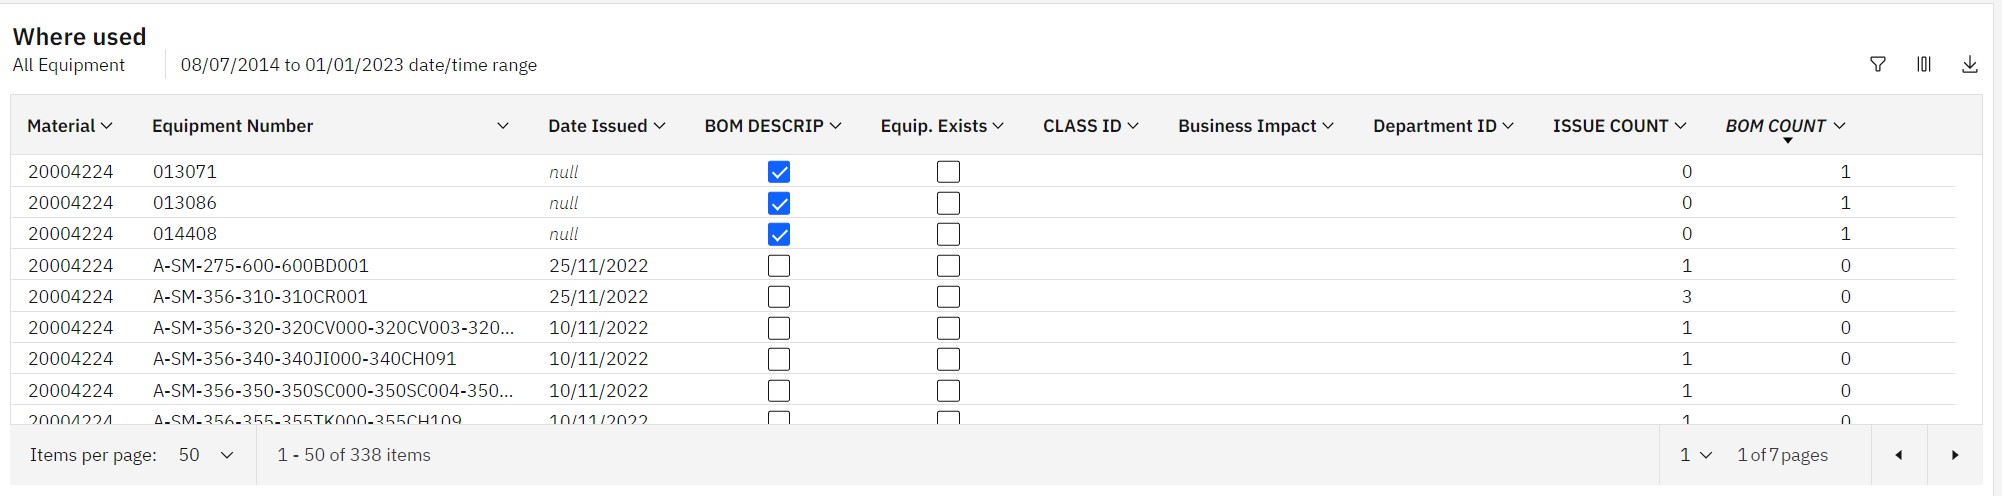
Eve searches the equipment, explodes the item list, adds the fields she needs and downloads the result. The same views answer other questions: which parts become obsolete when a fleet is retired, which assets are affected by a manufacturer's recall.
6Unplanned material consumption
Johnreliability engineerKPIs: maintenance cost, failure rate
John is not interested in stock levels. He wants to know which assets keep breaking.
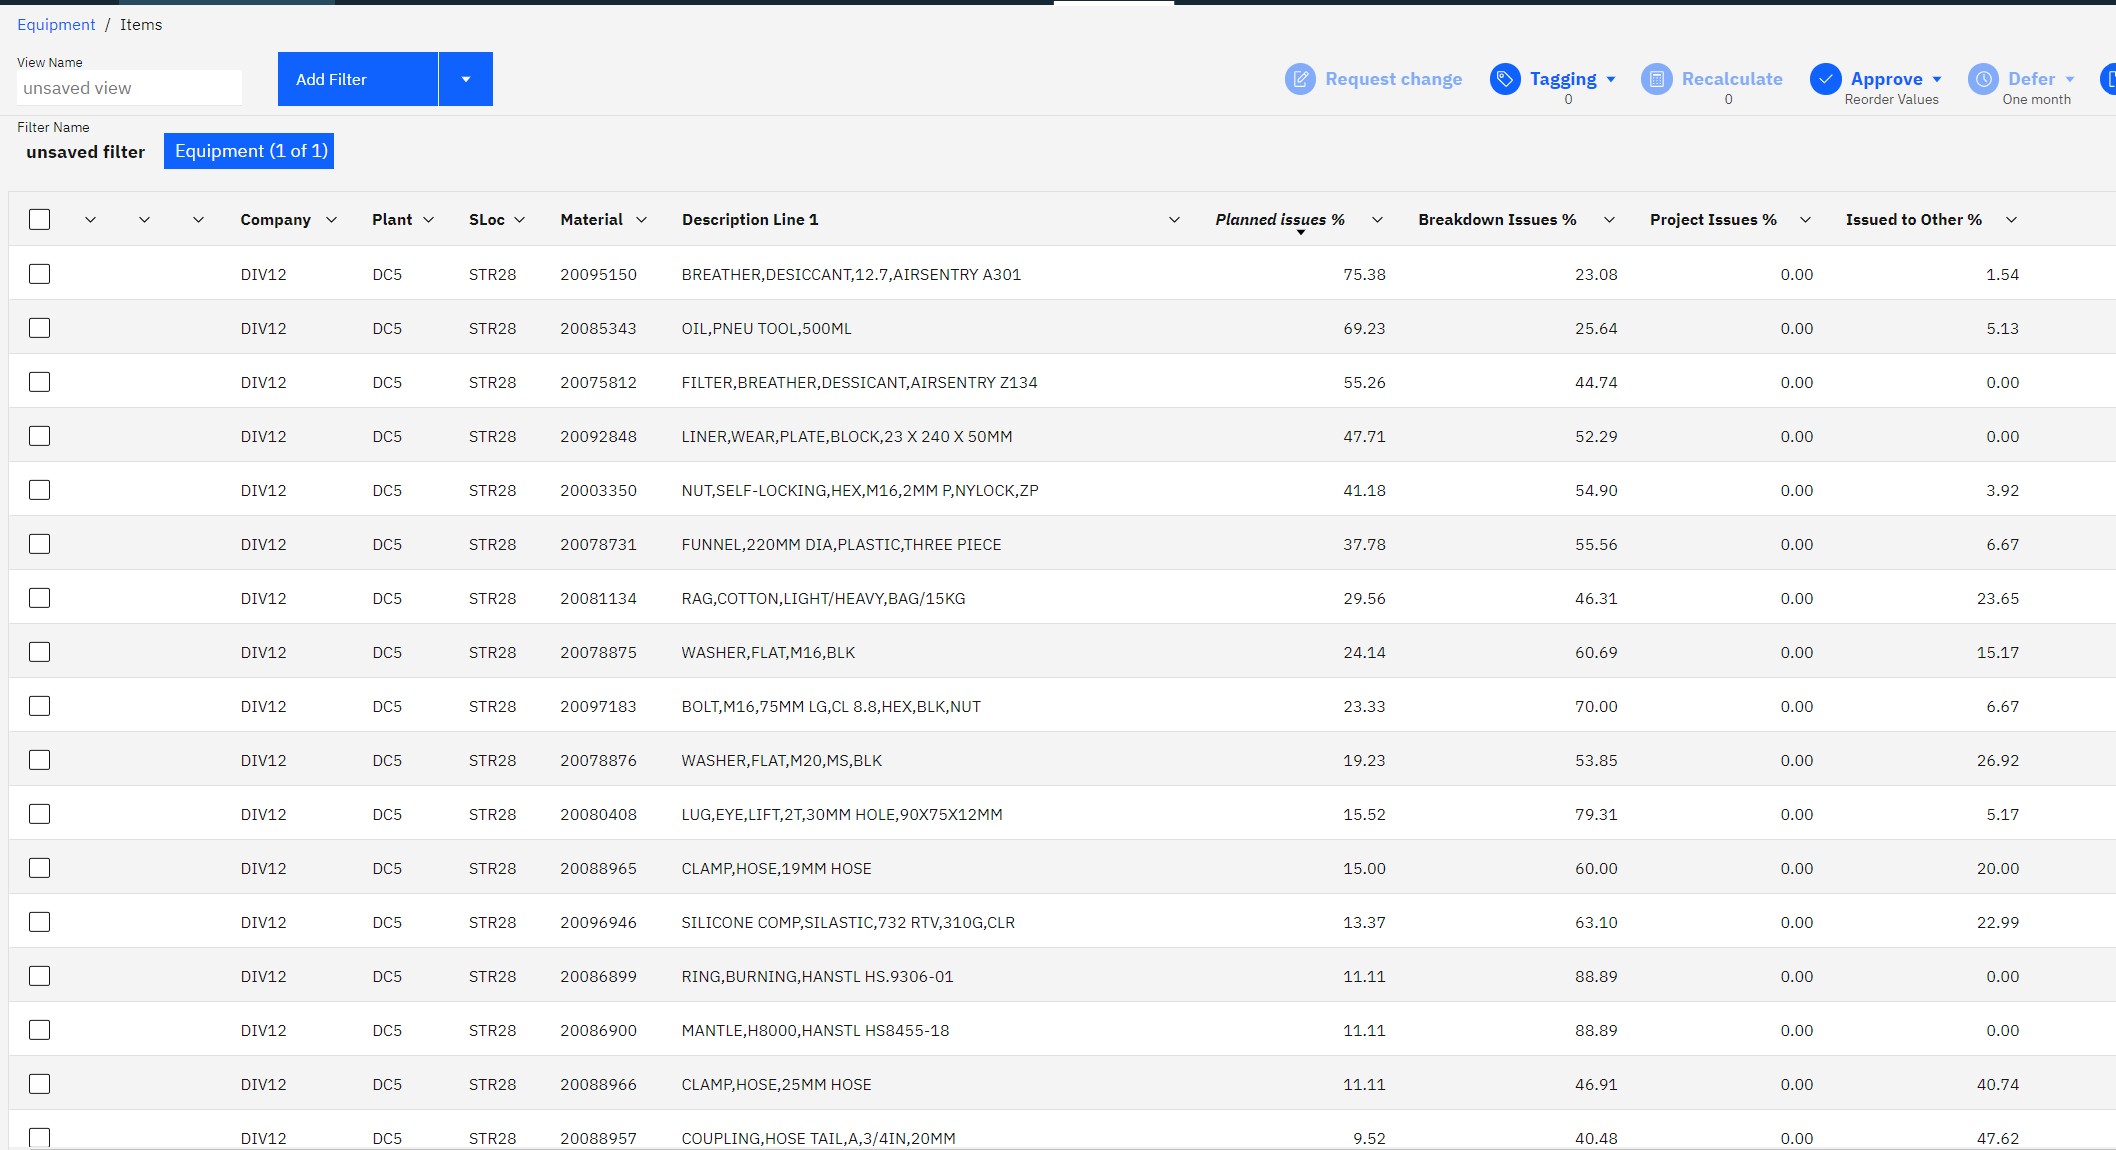
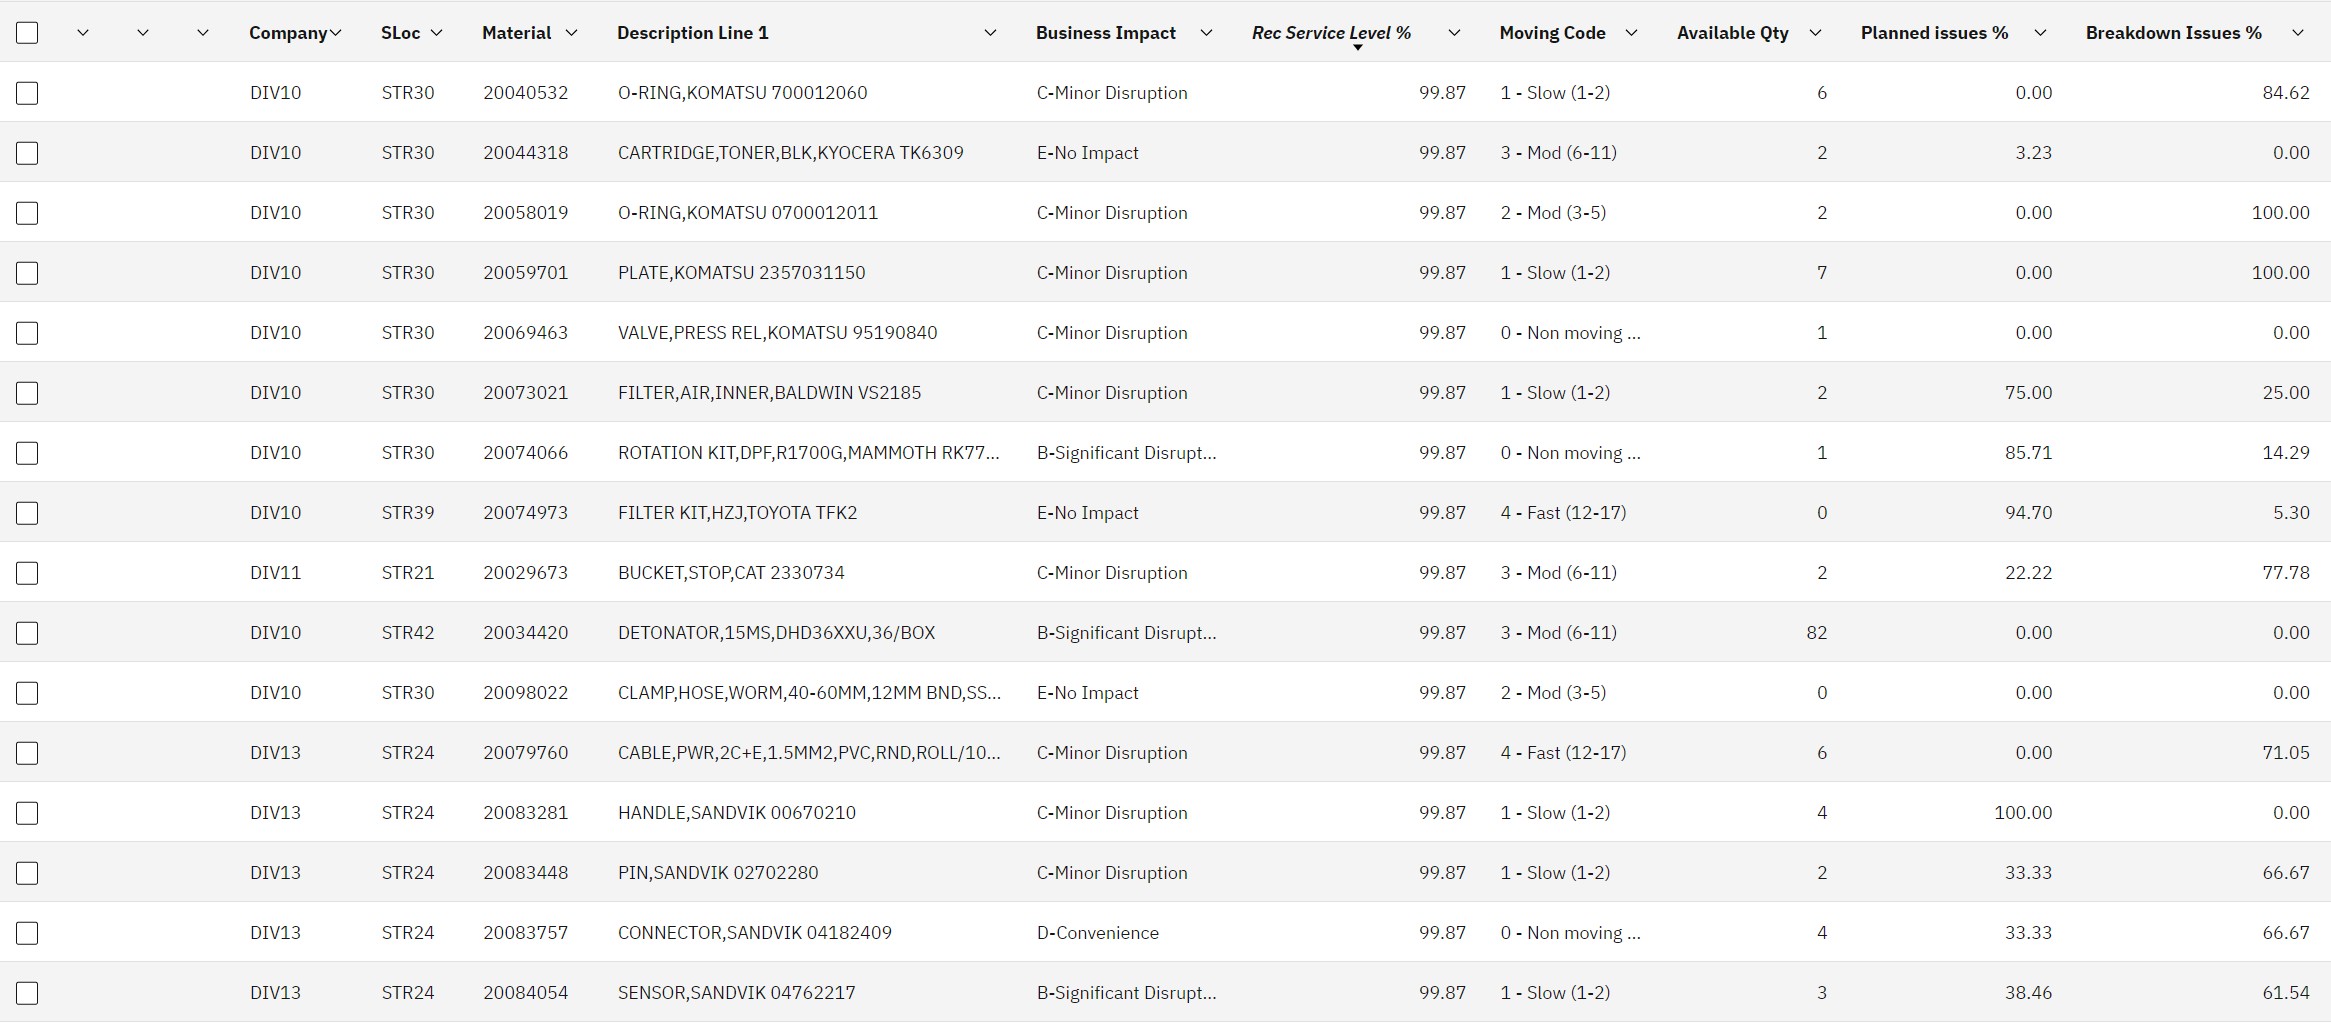
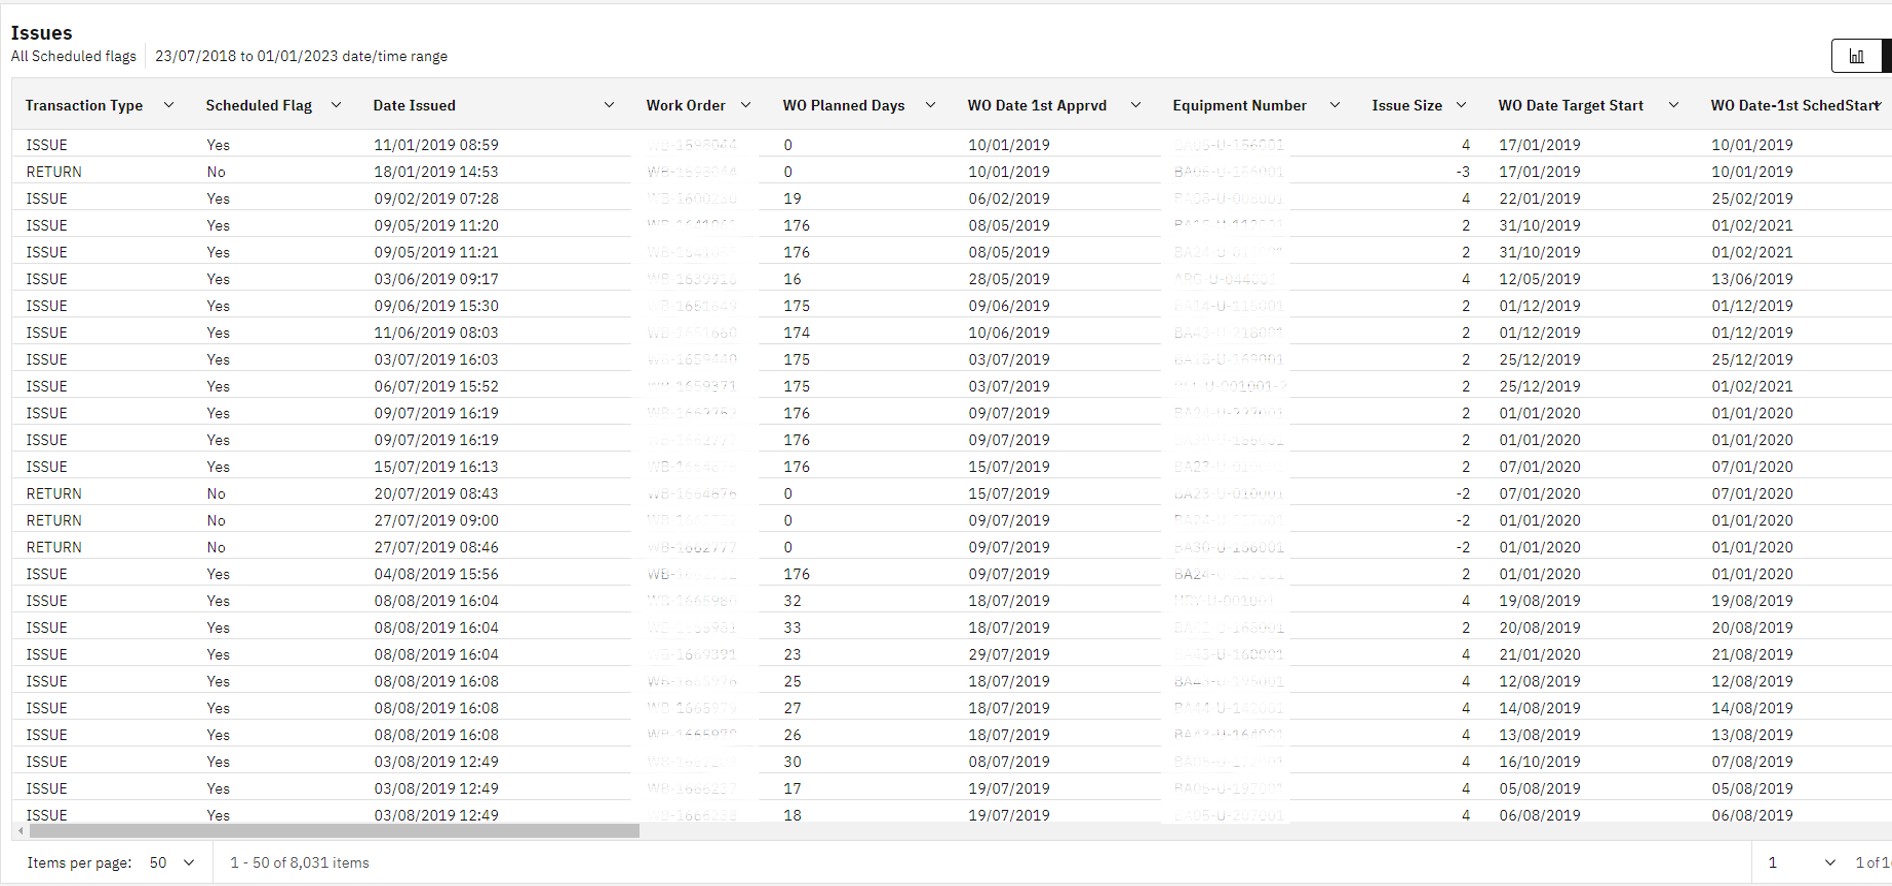
MIO knows whether each issue went to planned or unplanned work, from the work order. John narrows the period, recalculates, sorts by breakdown percentage and exports. A part issued 80% of the time to breakdowns says something about the asset, or about the maintenance plan.
7What can be ordered on demand
Davidsupply chain managerKPIs: holding cost, forecast accuracy
The mirror image of scene 6. If a part is only ever used on planned work, and the plan is known weeks ahead, why keep it on the shelf at all?

David filters for items issued only to planned work over the last year and exports the list: candidates to buy for each job instead of stocking. MIO can set reorder levels for unplanned usage only, or import the maintenance or project plan and stock for what is coming.

How to say it: "How much of your stock is there for work you already planned months ago?"
8Supplier lead-time performance
Jessicapurchasing officerKPIs: on-time performance, lead-time variability
Jessica runs the lead-time analysis across all items and filters: average vendor lead time above the contract, variance above a threshold. She downloads the list by supplier.
This is the same data Sam saw in scene 1A, viewed by supplier. A late or erratic supplier does not only delay one order; it forces every customer storeroom to hold more. MIO puts a number on that, which gives Jessica something to negotiate with.
More in the boxFeatures the scenes did not need
Smart Advisor: AI that explains itself
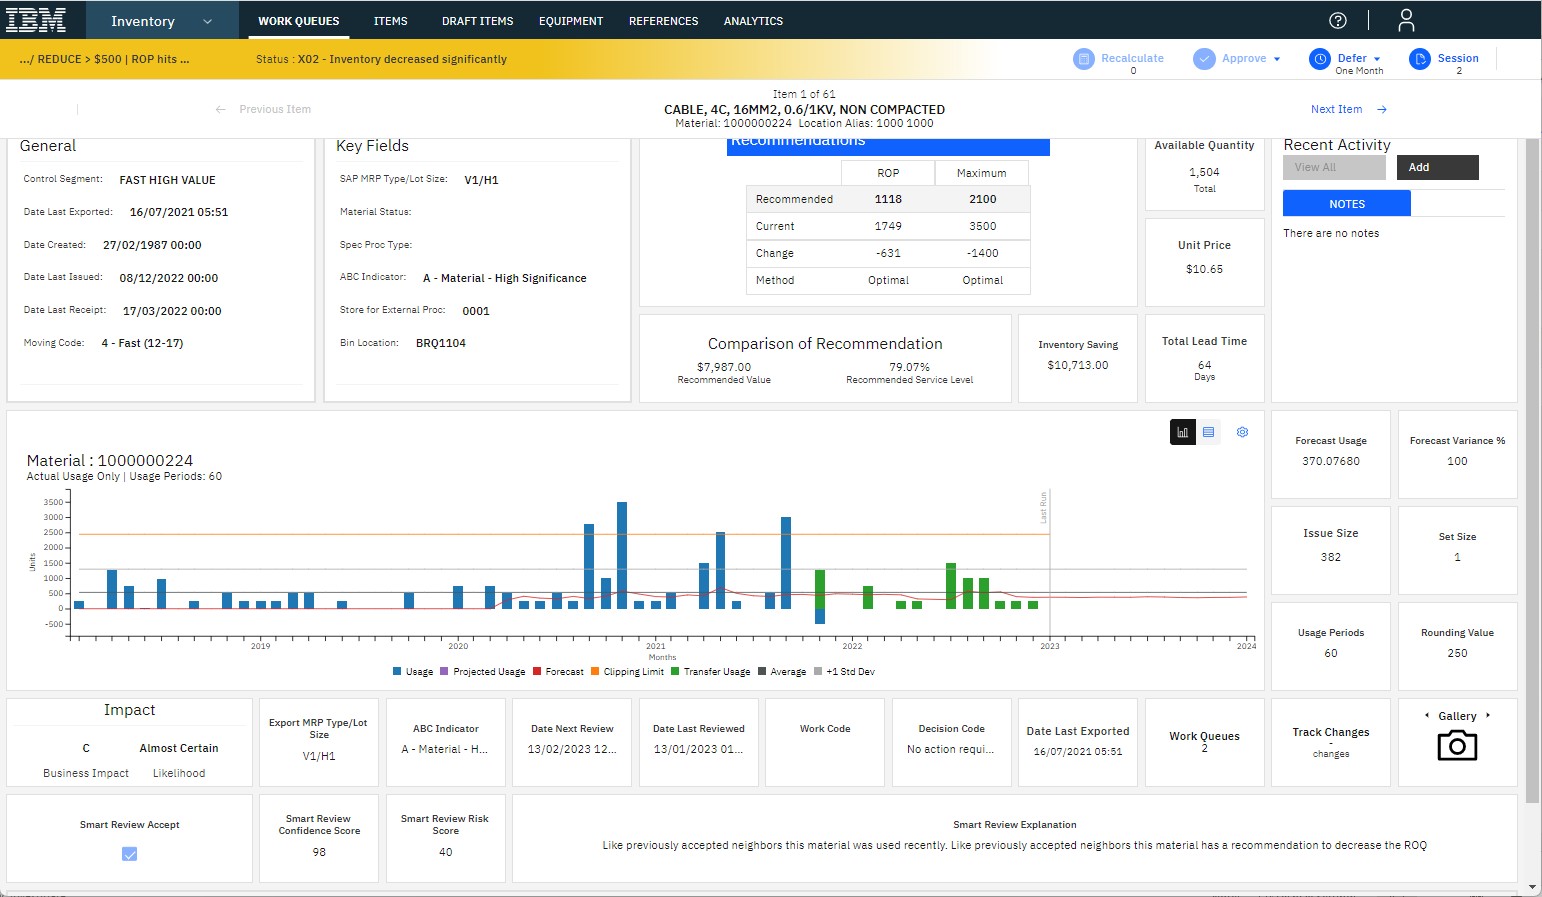
MIO has used machine learning for forecasting and optimisation from the start. Smart Advisor adds a model trained on past decisions: it predicts whether a planner would accept the recommendation, with a confidence score, a risk score and an explanation in plain language. High-confidence, low-risk advice can be applied automatically.
Draft items: the first level for a new part
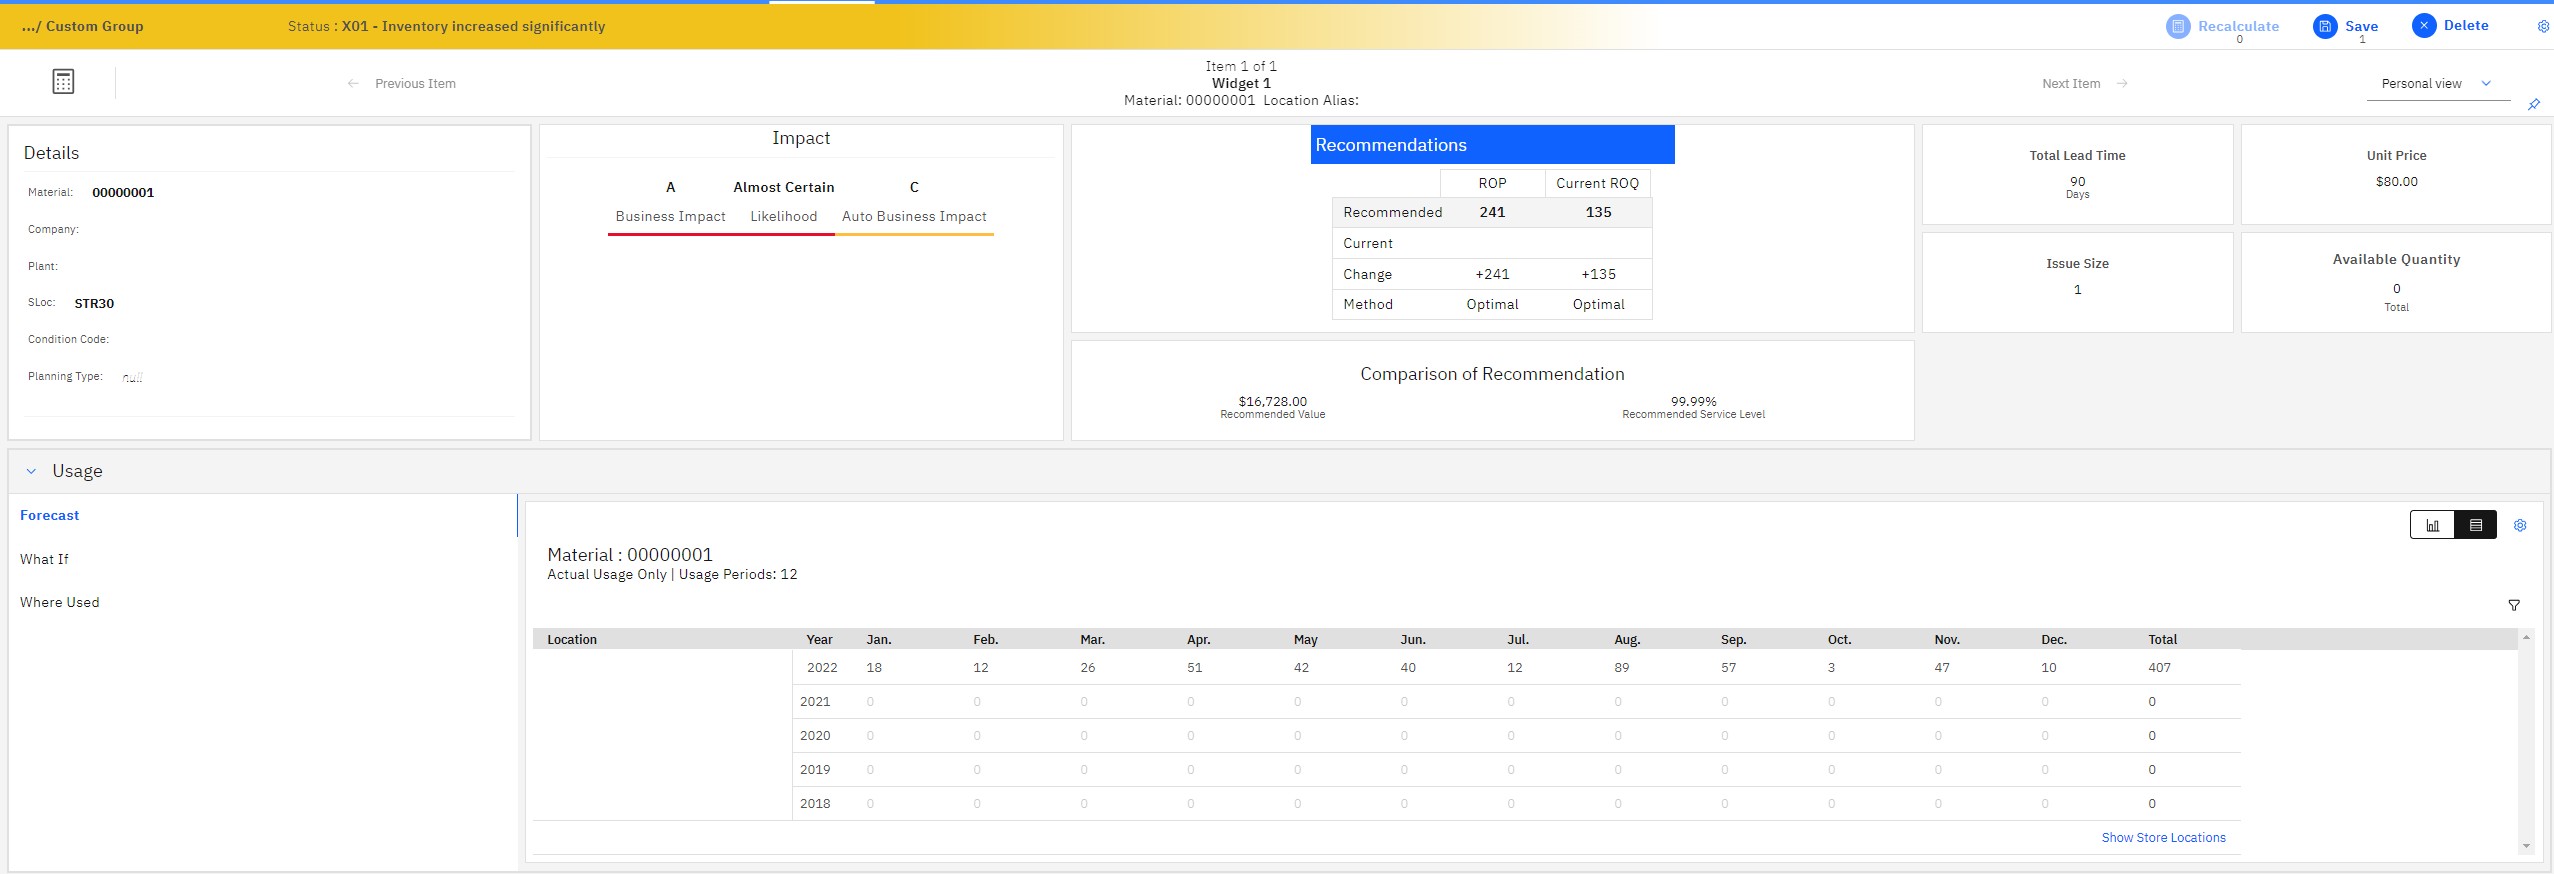
New parts are usually stocked by guess, and the guess is generous. With a few fields from the requester, MIO calculates the first level. IBM's deck cites a customer that saved 13% of its spending on new materials this way.
Duplicates and history
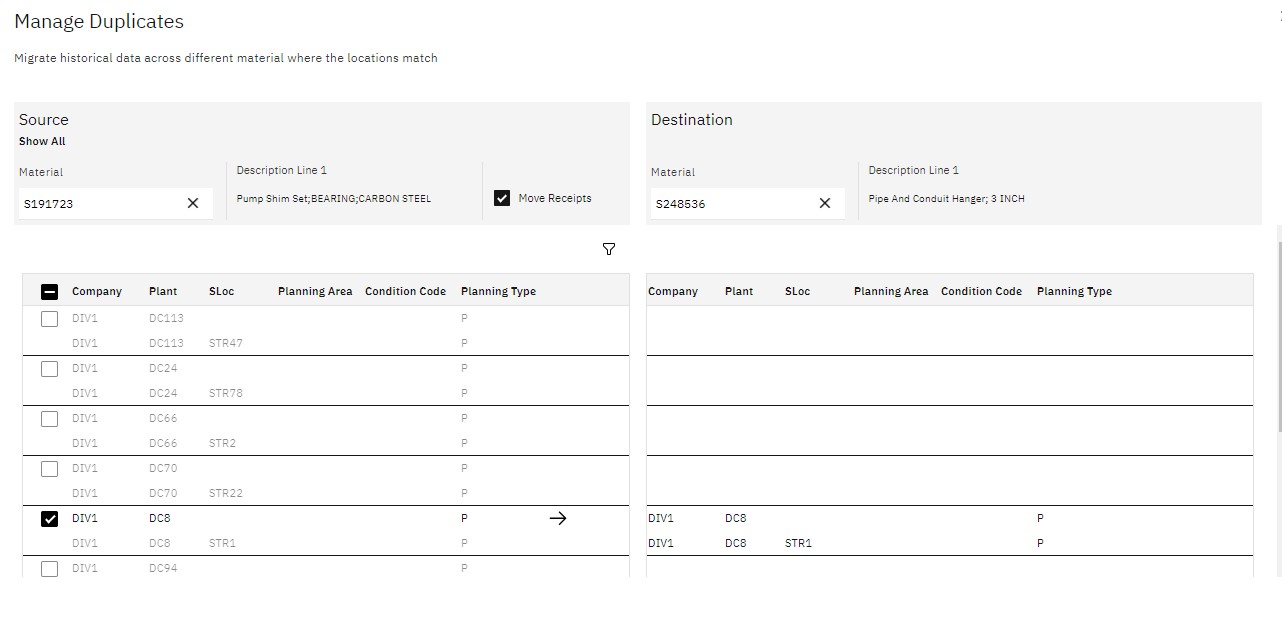
The same bearing under two numbers means two stocks. Once found, the history is merged onto one item. The same function keeps history when assets move site or when the company changes ERP.
Change requests and reports
The differentiators, and the proof
| What sets MIO apart | Where you saw it | What it means for the customer |
|---|---|---|
| Built for spare parts | Zero-one-two for slow movers, saw tooth for fast ones | Sensible levels for parts used once in years, where ERP planning fails |
| Criticality as a cost | Business impact matrix; recommended criticality from BOMs (3A, 4) | Stock follows what the plant cannot run without |
| Management by exception | Work queues, automatic export inside policy (1A, 1B) | A small team keeps tens of thousands of items right |
| Every trade-off priced | Comparison of settings, what-if, service level analysis (1B, 3B) | Reductions without surprises; decisions finance and maintenance both accept |
| Real lead times | Lead-time analysis from receipts (1A, 8) | Levels match how suppliers really deliver |
| Planned against unplanned | Issue type analysis (6, 7) | Stock for breakdowns, buy for planned work |
| Auditable control | Workflow rules, change requests (3A) | Delegated authority enforced and recorded |
| Works beside any EAM or ERP | The monthly loop | No replacement project; value in months |
How to spot a need
- "Maintenance says the store never has the part. Finance says the store is full."
- "Our min/max levels were set at go-live and never touched."
- "We have been asked to cut inventory by a percentage."
- "Everything is marked critical."
- "We are merging storerooms, retiring a fleet, or moving to a new ERP."
- "We write off obsolete stock every year."
- "Technicians keep their own stock because they do not trust the store."
Common mistakes when positioning it
- Selling it as an inventory system. It does not issue or receive. The EAM does. MIO tells the EAM what the levels should be.
- Talking only about savings. Half the value is availability. Lead with the stock-out queue when you speak to maintenance, with the savings queue when you speak to finance.
- Promising a result without data. The recommendation is only as good as the issue history and the criticality. Scenes 4 and 5 are how the data gets better.
- Demoing every screen. Pick the scene of the person in the room.
Check yourself
1. A customer says: "Our ERP already calculates min/max." What is different?
ERP planning assumes regular demand. Most spare parts are slow and irregular. MIO forecasts each item with the method that fits it, treats slow movers with the zero-one-two method, and prices the cost of a stock-out by criticality.
2. What is a work queue?
A saved rule that lists the items needing review, such as stock-out risk or savings above an amount. It refills itself as data changes.
3. In scene 1B, stock value falls 51%. What happens to the service level?
It moves from 100% to 99.80%. The comparison shows both, with every cost line, before Sam accepts.
4. Finance wants $5.2M out of $52.4M. Where does Sam look first?
At the surplus MIO has identified ($17.6M), starting with items of no business impact ($7.0M of surplus).
5. A supplier averages 4 days but with 83% variance. Why does the variance matter?
The reorder point must cover demand during the wait. With high variance some deliveries take much longer than average, so the level must be higher, which costs money. That is the supplier's cost to the customer.
6. Which parts are candidates for order-on-demand?
Those issued only to planned work, where the need is known before the lead time.
Glossary
- MRO
- Maintenance, repair and operations: the spare parts and consumables that keep assets running.
- ROP
- Reorder point: the stock level at which more is ordered.
- Maximum
- The level stock is refilled to.
- Business impact
- MIO's criticality, A (major disruption) to E (no impact).
- Service level
- The probability that a part is available when requested.
- Lead time
- Days between ordering and having the part on the shelf.
- Work queue
- A rule-based list of items that need review.
- Workflow
- The approval path for changes above a user's authority.
- What-if
- A model of stock and cost under different settings, before committing.
- Zero-one-two
- The method for slow movers: is it cheapest to hold none, one or two?
- BOM
- Bill of materials: the list of parts an asset is made of.
- Issue
- A part taken from the store, usually against a work order.
- Planned / unplanned issue
- Whether the part went to scheduled work or to a breakdown.
- Surplus
- Stock above the recommended maximum.
- EAM
- Enterprise asset management system, such as Maximo.
Scenes follow IBM's Maximo Inventory Optimization demo deck; the explanations are the author's. Screens: IBM MRO Inventory Optimization. Item names, amounts and quantities are demo data.