IBM Maximo Real Estate and Facilities · Space planning and management
312 seats, 120 people: planning one floor with Maximo Real Estate and Facilities
A company leases a four-floor office in Charlotte. One floor has room for 312 people, and 120 sit there. The rent is the same either way. This post follows a space planner through Maximo Real Estate and Facilities (MREF), from the floor's numbers to a plan that moves whole departments, and explains every term and number on the way.
- How a building is described in MREF: buildings, floors and spaces, each with its area.
- What gross, rentable and usable area mean, and why the difference costs money.
- How capacity, headcount and utilization show whether space is being used.
- How chargeback makes each department pay for the space it holds.
- How a stack plan decides which department goes on which floor, and turns into a move list.
Reading time: about 15 minutes.
Before we startSpace management in two minutes
After people, space is usually an organization's biggest cost. Yet many companies can't answer simple questions about it: how many desks do we have, how many are used, which department holds which rooms, and could we fit everyone on fewer floors?
Space management keeps an accurate record of every floor and room, who uses it and who pays for it. Space planning uses that record to decide what changes next: a team grows, a floor is renovated, a lease ends. MREF does both on the same data: the floor plans, the room list, the departments and the people.
Our example. GreenPoint Corporation occupies the Watson Center in Charlotte, a leased office building
with four floors. We follow the space planner (demo login pplanner) on the second floor, then across the
whole building.
Chapter 1The portfolio at a glance
The space planner's home page starts with the big picture. The main chart counts the rooms on every floor of every building by occupancy status: occupied, partially occupied, over-allocated or vacant.
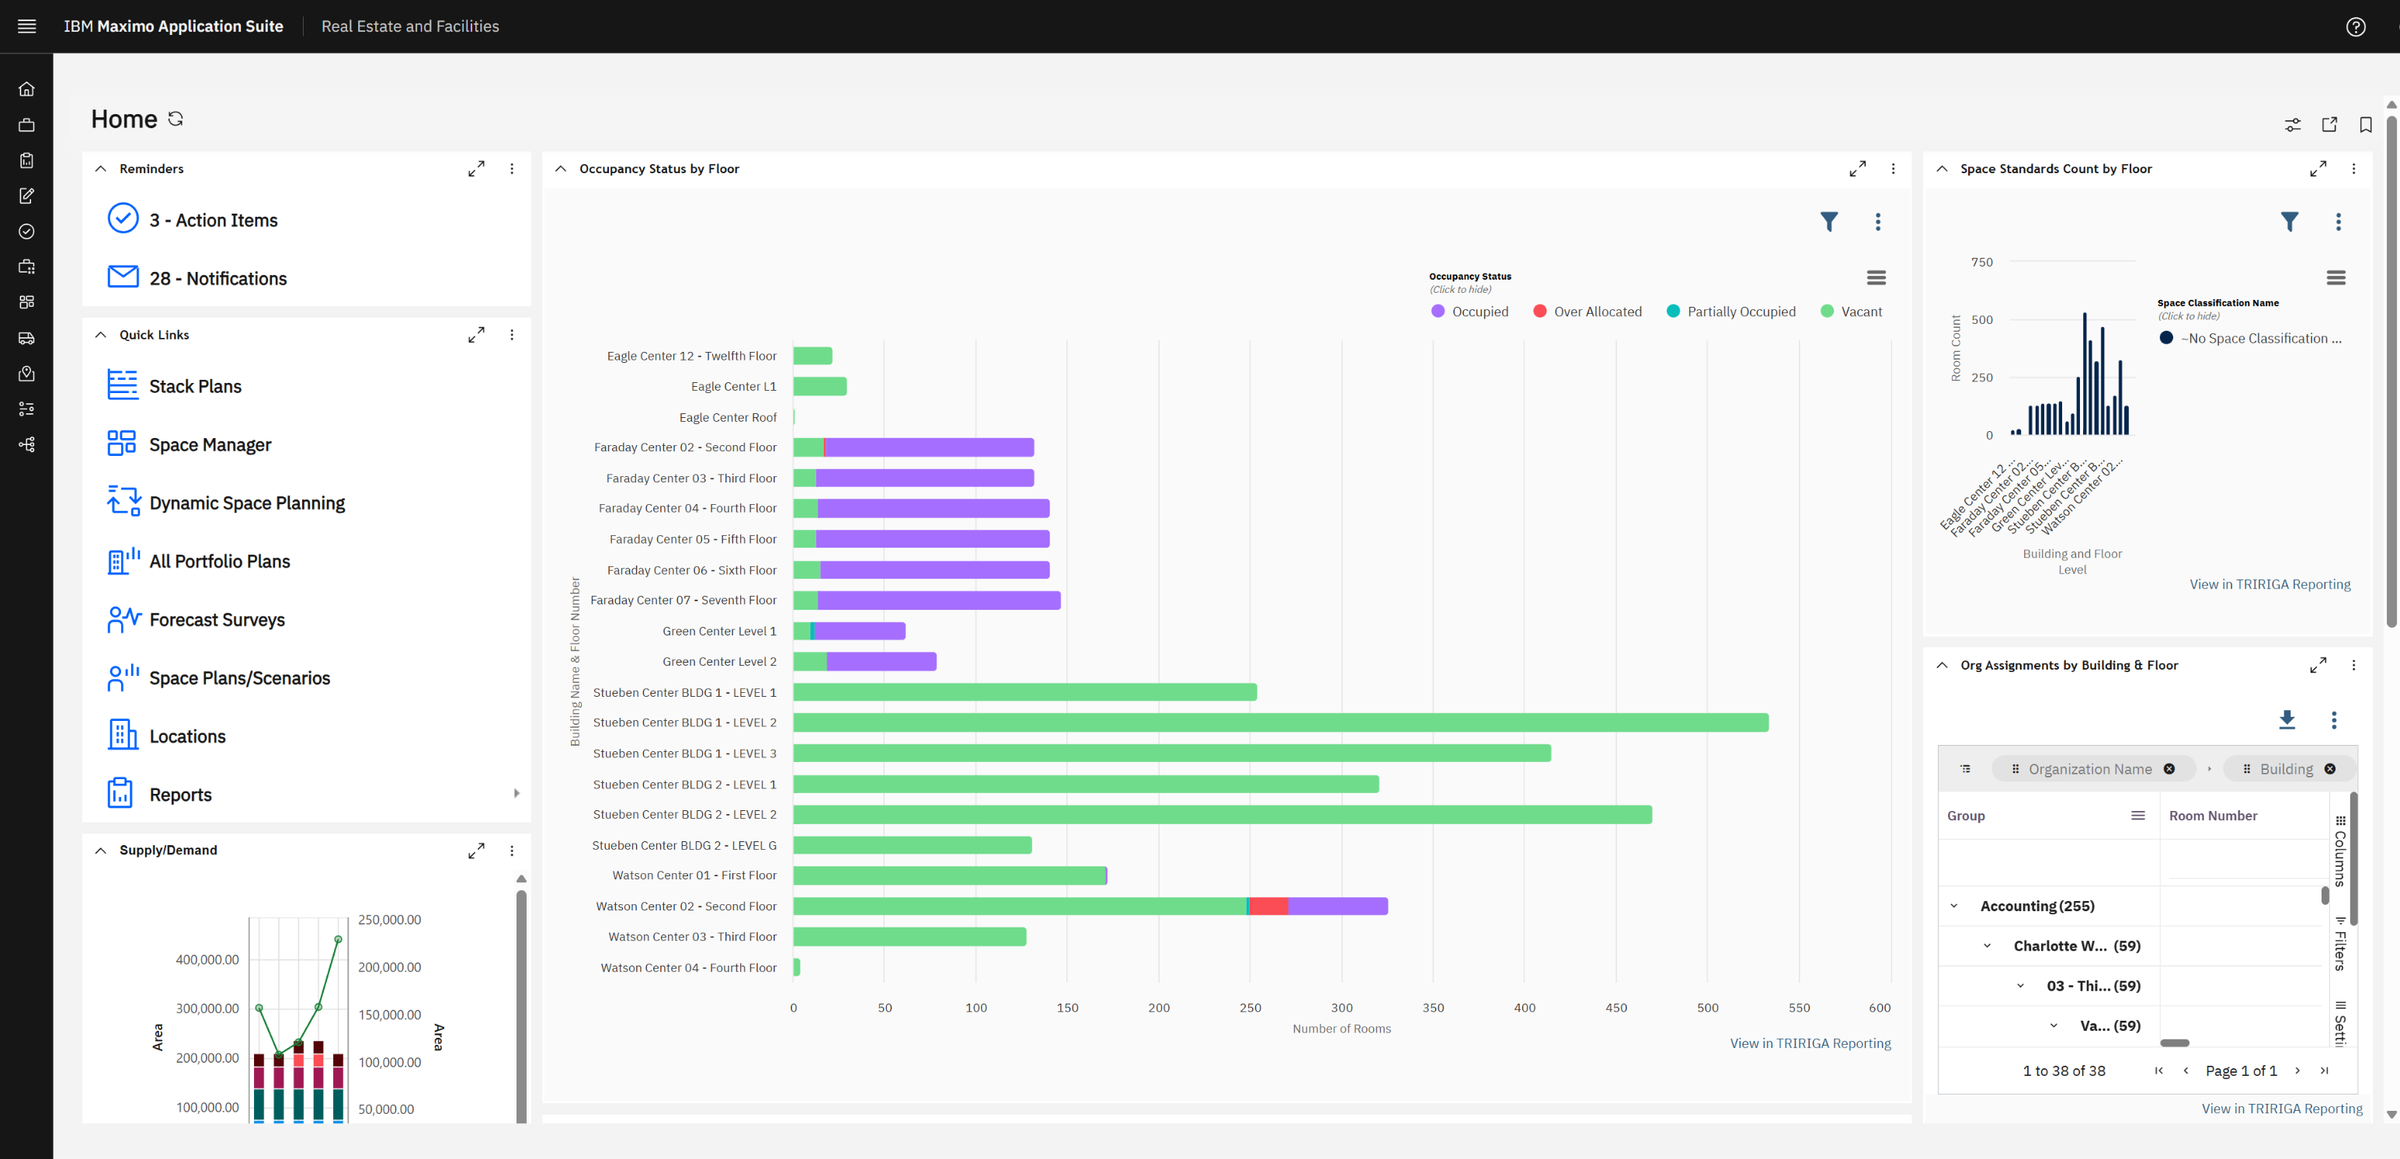
Look at the Watson Center rows near the bottom. The second floor is the only one with a mix of colours: some rooms occupied (purple), a few over-allocated (red, more people assigned than the room holds), and many vacant (green). That is where our planner starts.
Each room has a capacity (how many people it can hold) and a headcount (how many are assigned to it). Comparing the two gives its status: vacant (0 people), partially occupied (fewer than capacity), occupied (full) or over-allocated (more than capacity). MREF works this out from the assignments; nobody types it in.
Chapter 2The floor record
Every floor is a record with its own numbers. Here is the second floor of the Watson Center.
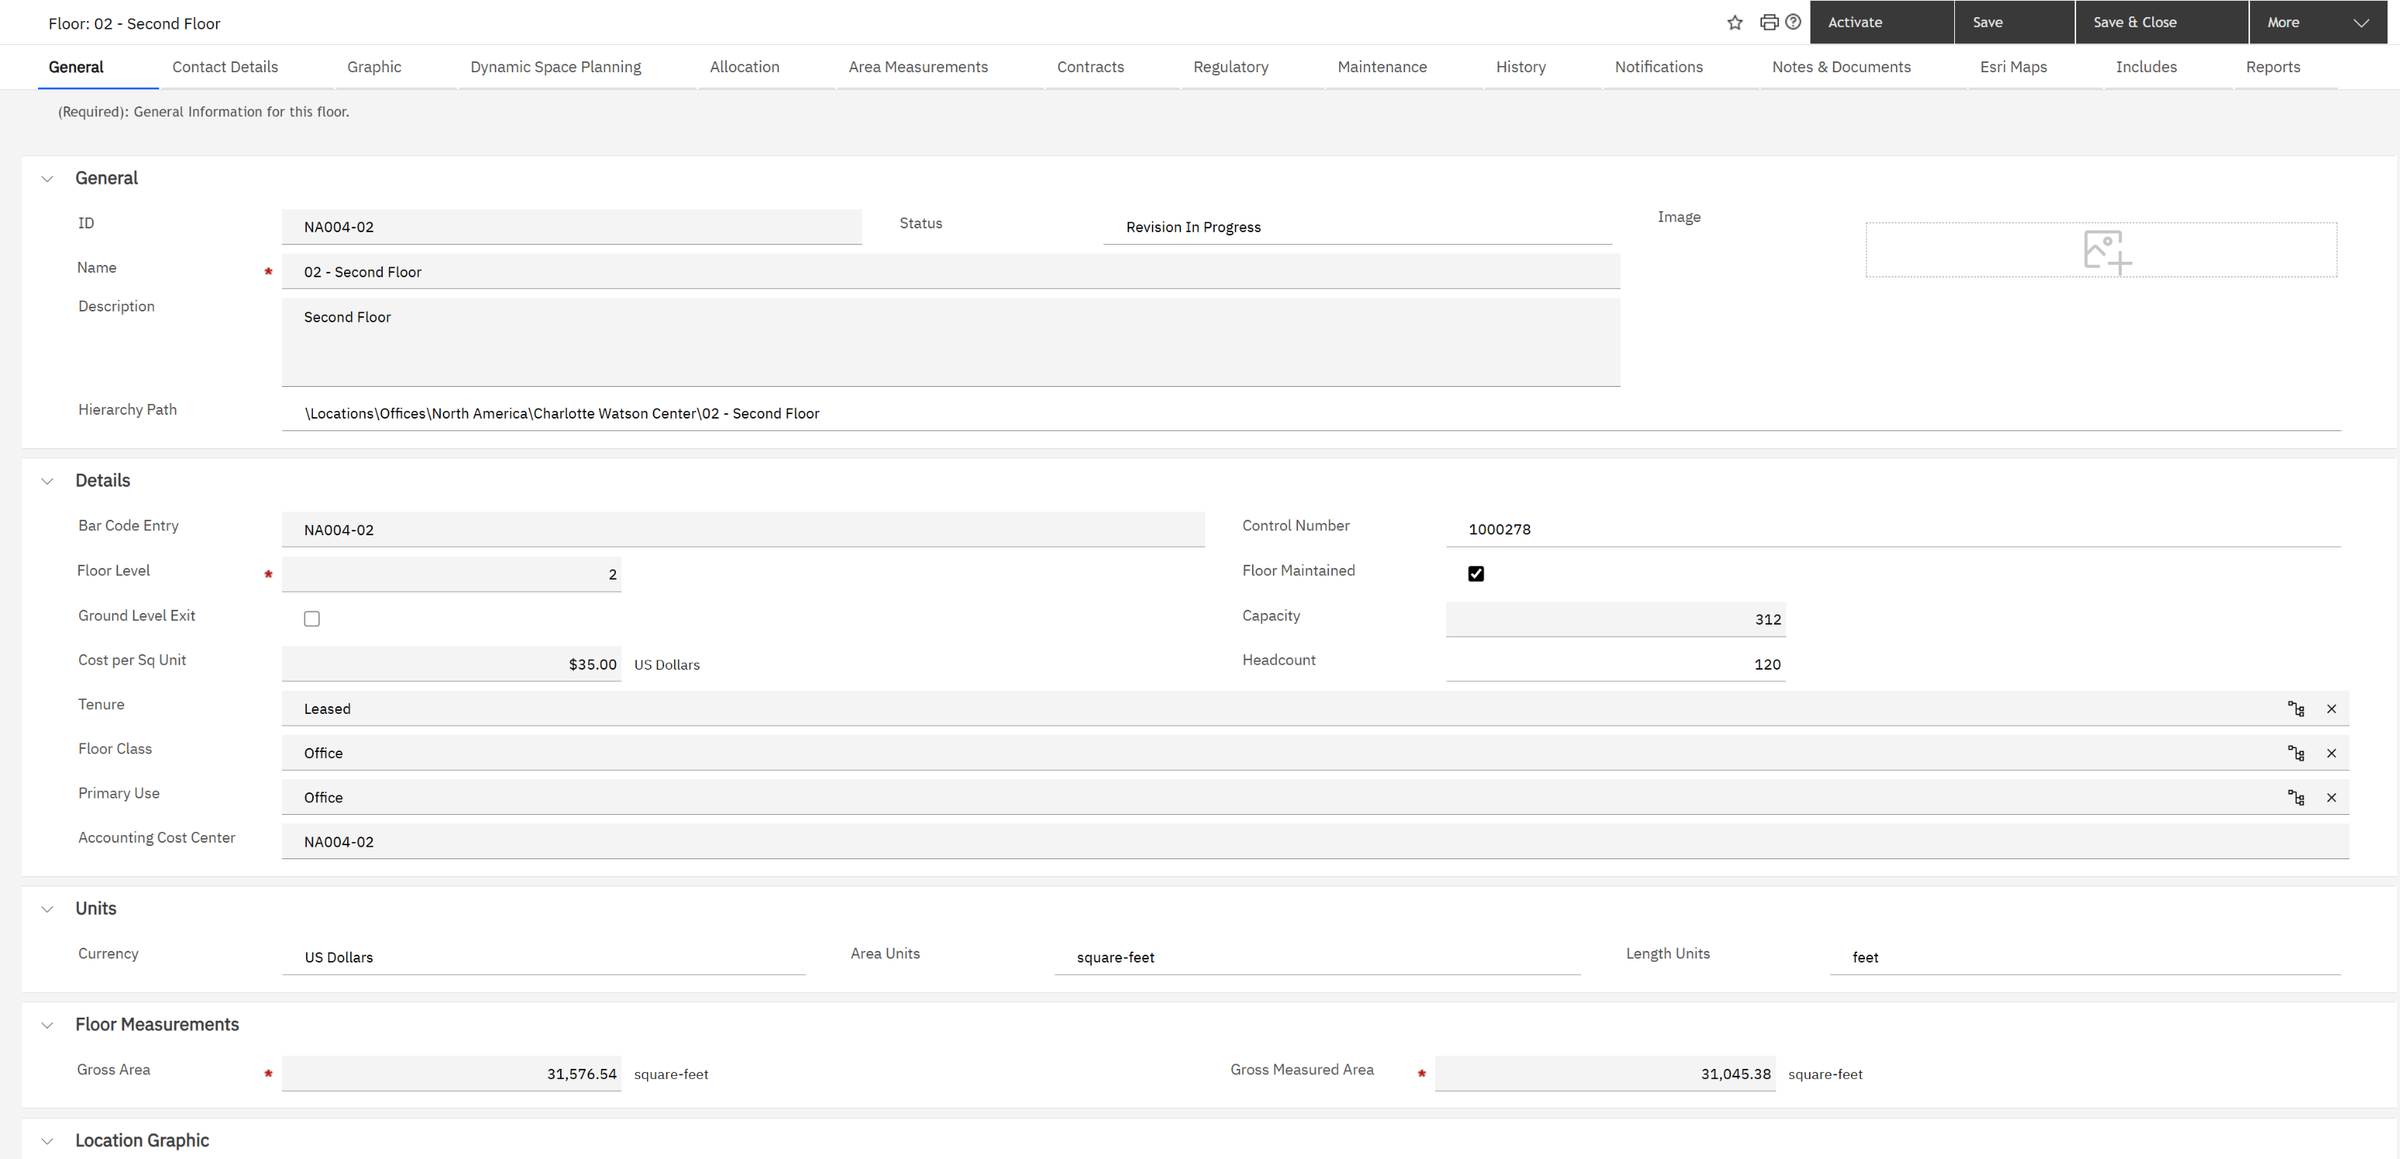
The fields that matter for planning: Tenure is Leased (GreenPoint rents this floor); Cost per Sq Unit is $35 a year; Capacity is 312 people and Headcount is 120. The status reads Revision In Progress: someone is updating the record, and MREF keeps the previous version until the change is approved.
Utilization = headcount ÷ capacity = 120 ÷ 312 = 38%. Almost two seats in three are empty.
Yearly cost = gross area × cost per square foot = 31,576.54 × $35 = $1,105,179.
Per person actually sitting there: $1,105,179 ÷ 120 = about $9,200 a year.
If the floor were full: $1,105,179 ÷ 312 = about $3,540.
The rent doesn't change with the headcount, so every empty seat raises the cost of every occupied one.
Chapter 3Measuring the floor properly
"How big is the floor?" has more than one answer. The Area Measurements tab shows them side by side, then lists every space with its area, capacity, headcount and status.
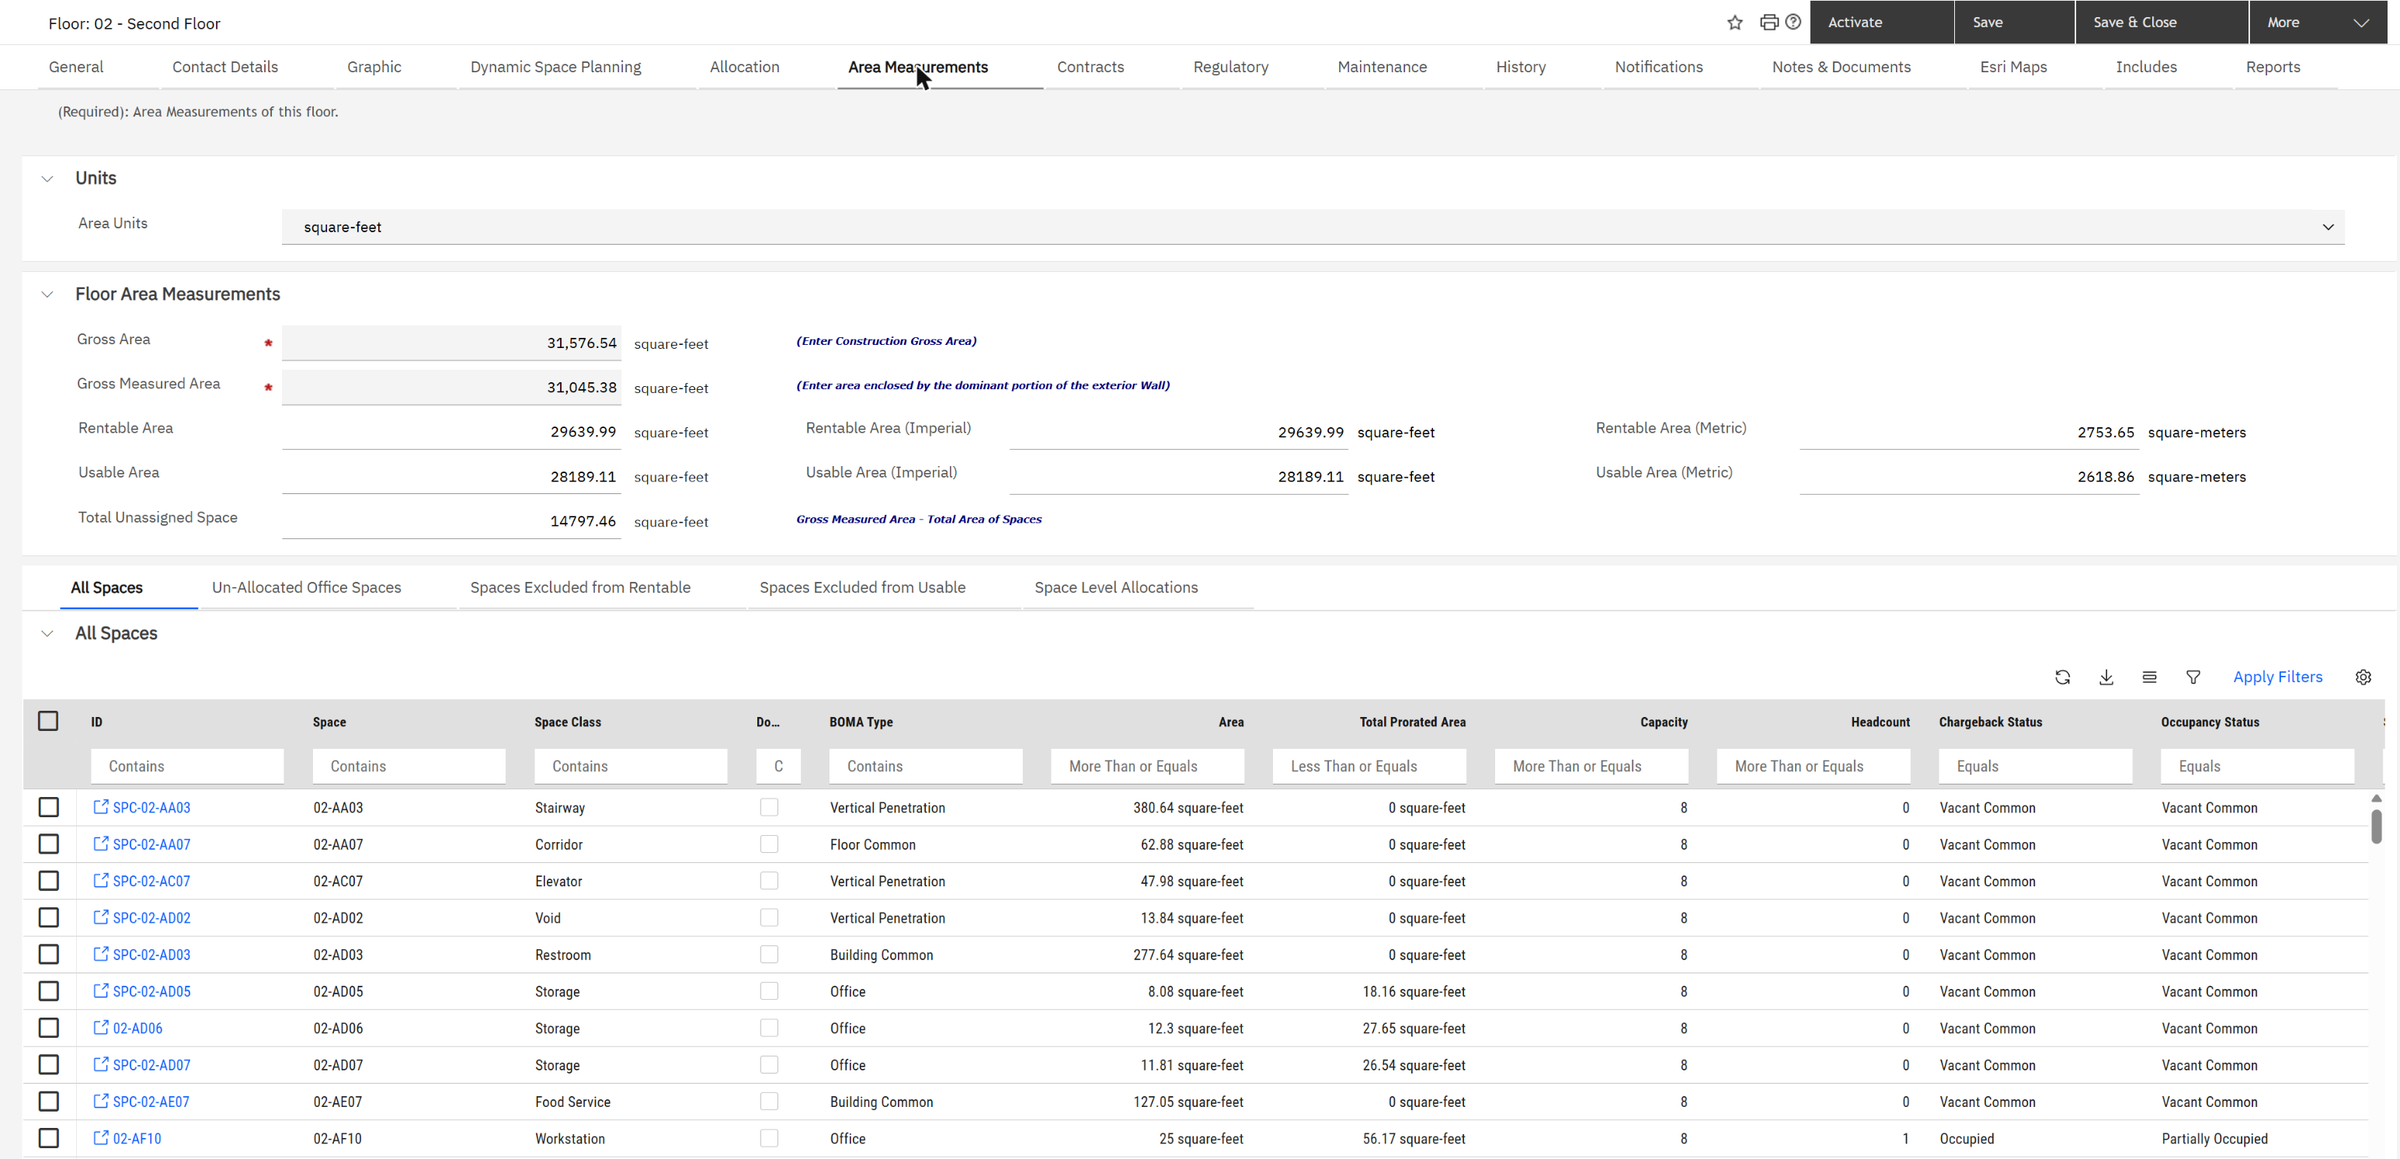
Gross area is the whole floor to the outside of the walls. Usable area is what the occupants actually use: offices, desks, meeting rooms. Rentable area is usable area plus a share of the common areas (corridors, restrooms, lobbies) that a landlord charges for. Industry standards such as BOMA define exactly which space counts where; the BOMA Type column in the list shows each room's category.
Rentable ÷ usable = 29,639.99 ÷ 28,189.11 = 1.05. This is the load factor: GreenPoint pays for about 5% more area than it can actually use.
The list also shows how a room is classed. Row 1, a stairway, is a Vertical Penetration: it doesn't count as rentable at all. The last row, workstation 02-AF10, is Office space with a capacity of 8 and a headcount of 1: partially occupied.
Chapter 4Seeing the floor
Numbers are hard to picture. The Dynamic Space Planning tab draws the floor from its CAD drawing and colours every room by whatever you choose. Here the colour is the space class: what kind of room it is.
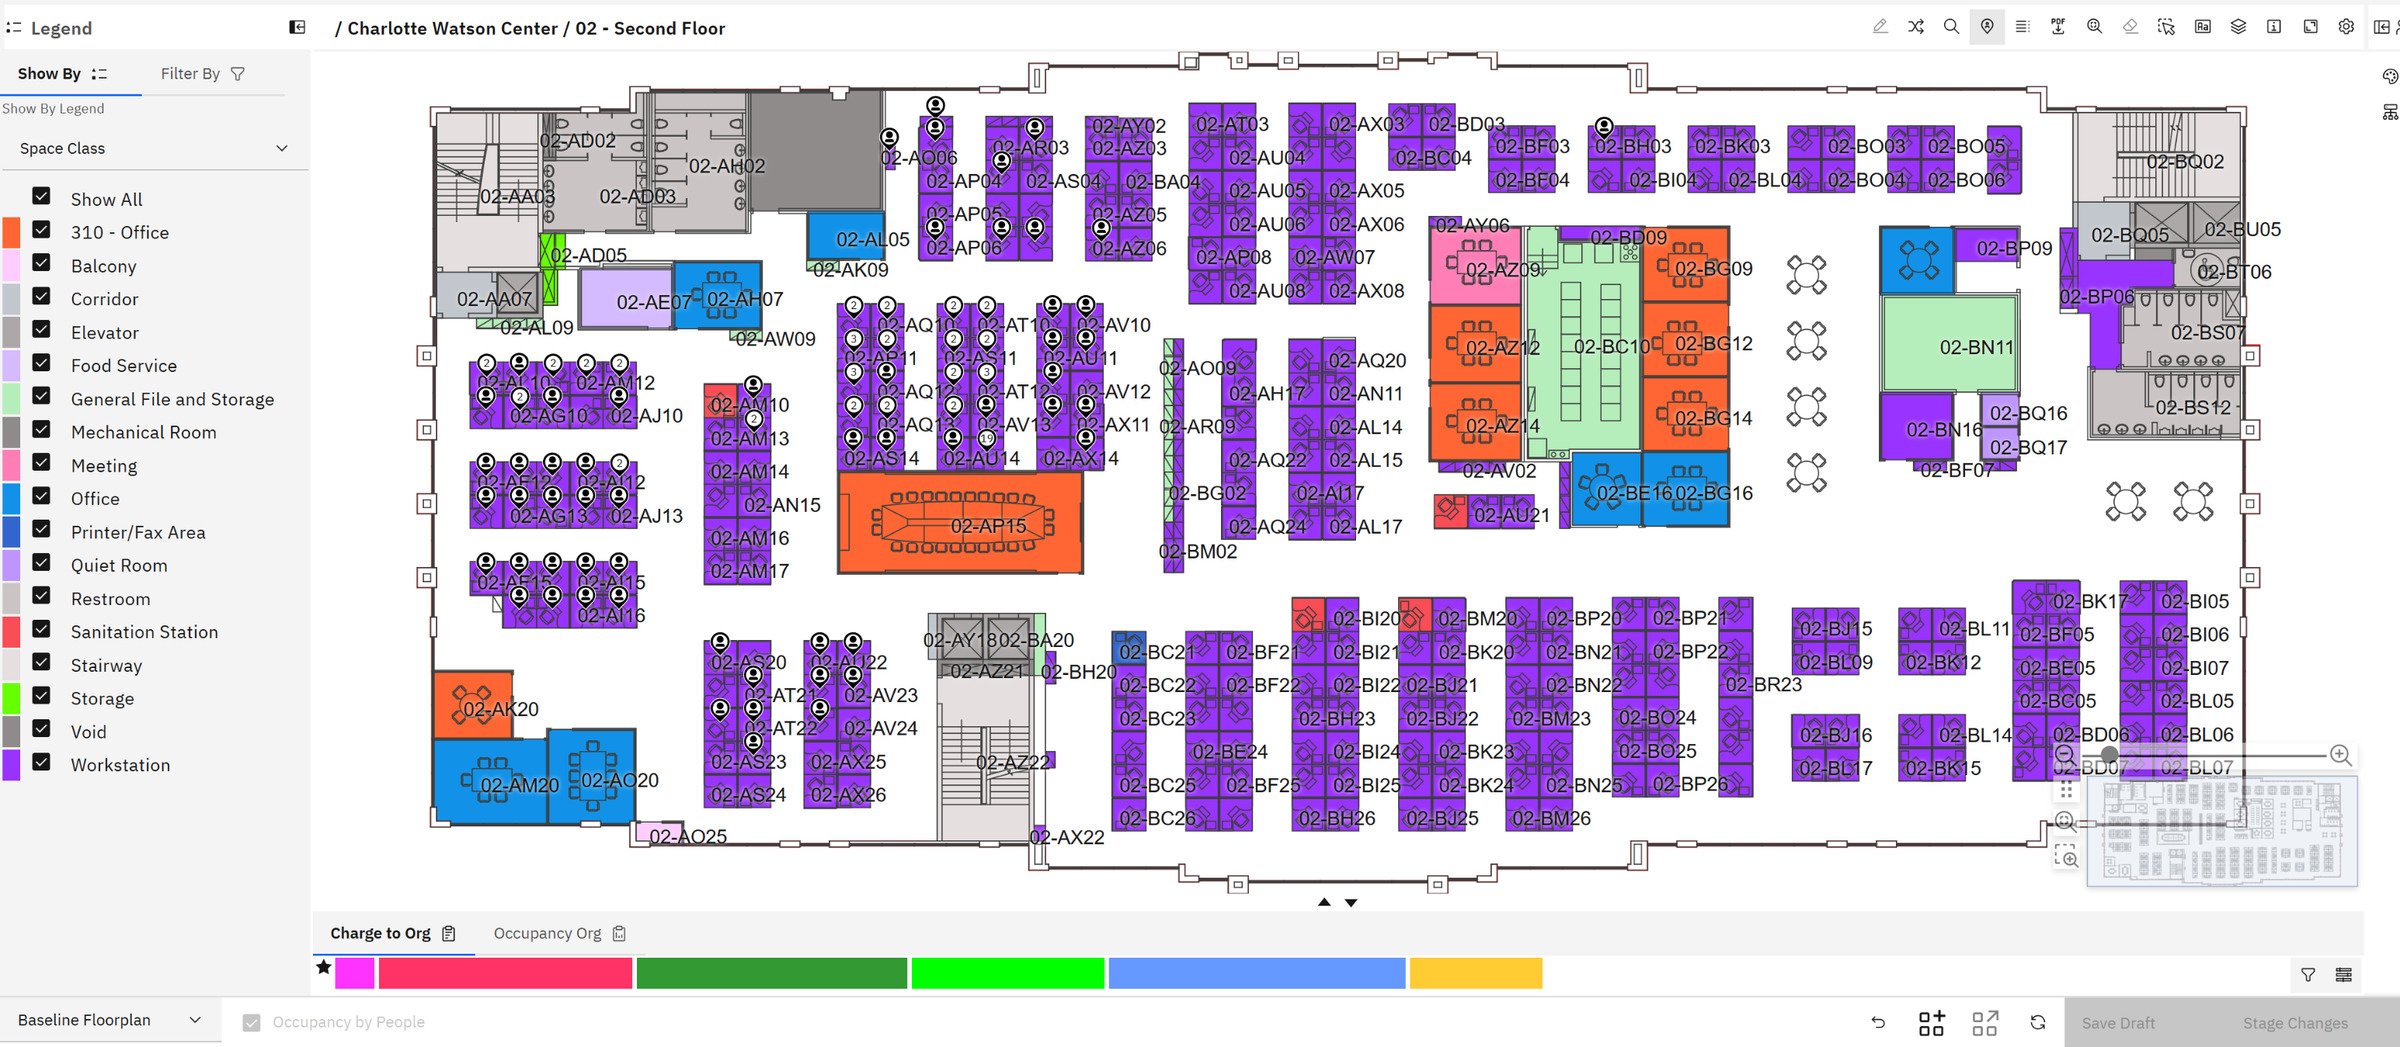
Purple is the workstation areas, orange the meeting rooms, blue the closed offices, grey the shared areas and the building core. The pins are people: a number in the pin means several people share that space. The pins are crowded in the top left corner and the rest of the floor is almost empty, which matches the 38% from Chapter 2.
Switch the colouring from Space Class to Charge to Org and the same floor shows which department each room belongs to.
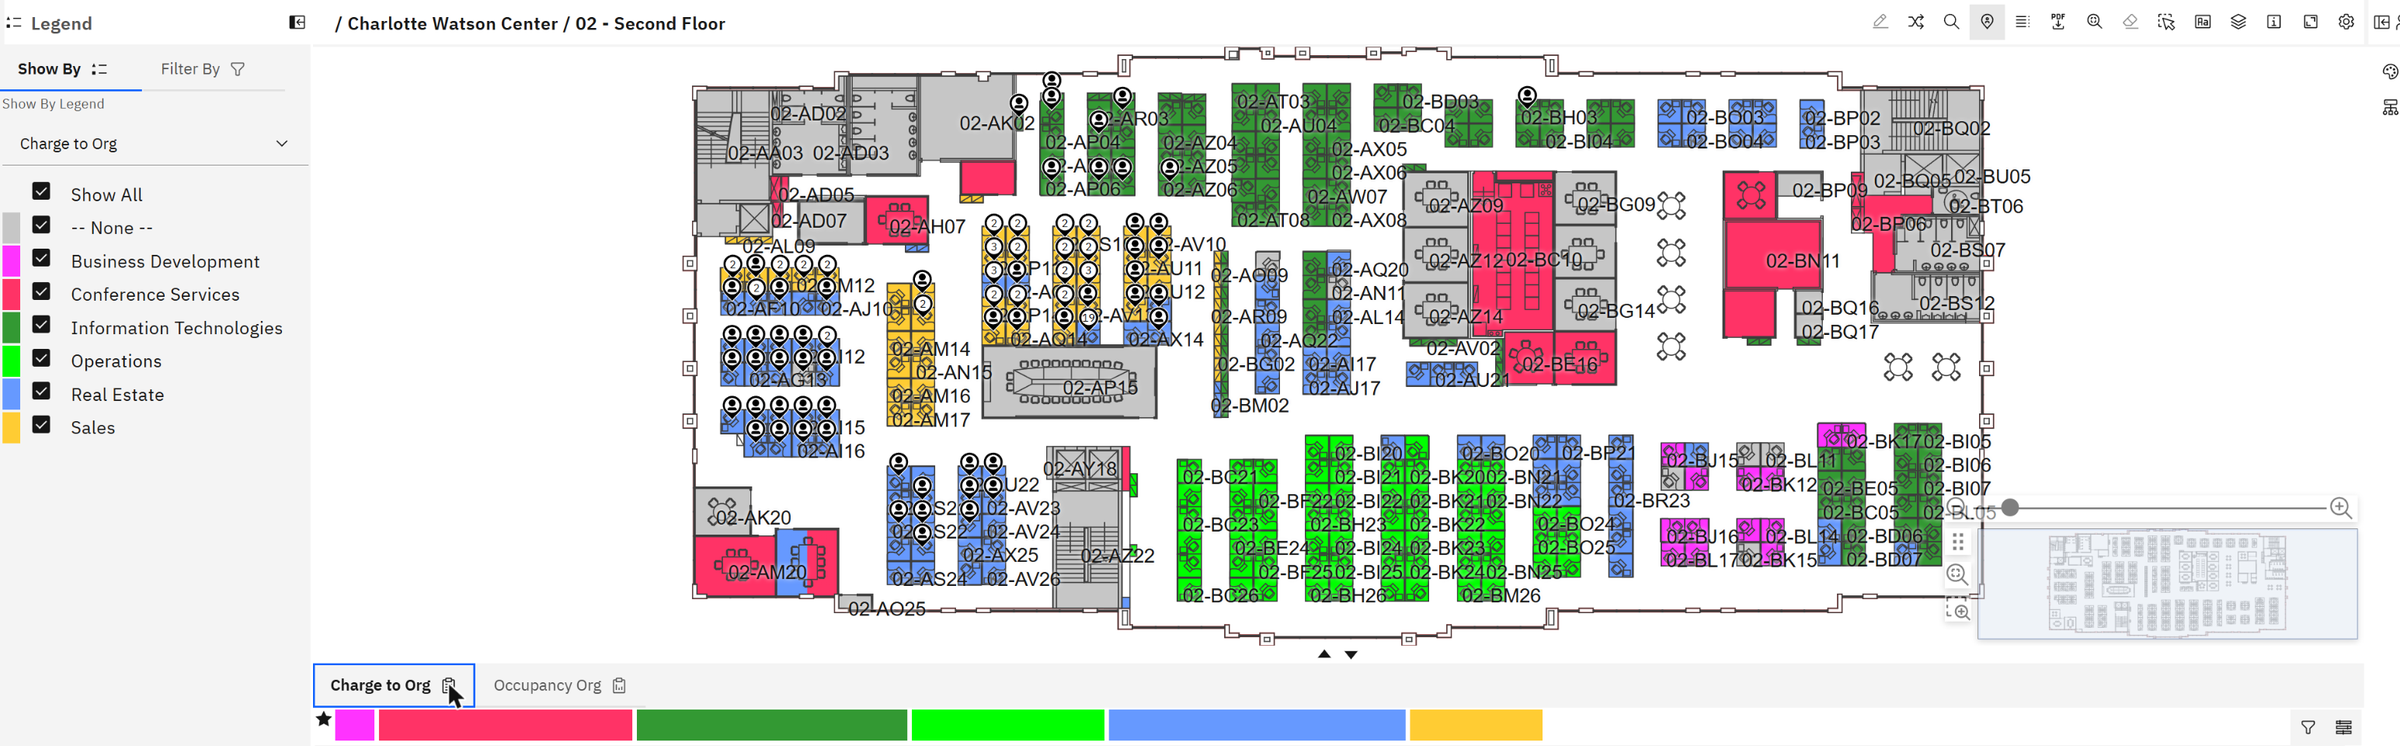
Chargeback means each department pays, in its own budget, for the space it holds. It is the most effective way to make people give space back: a department that pays for 40 empty desks soon asks to give them up. MREF knows each room's area and its department, so it can calculate every department's share of the floor's cost.
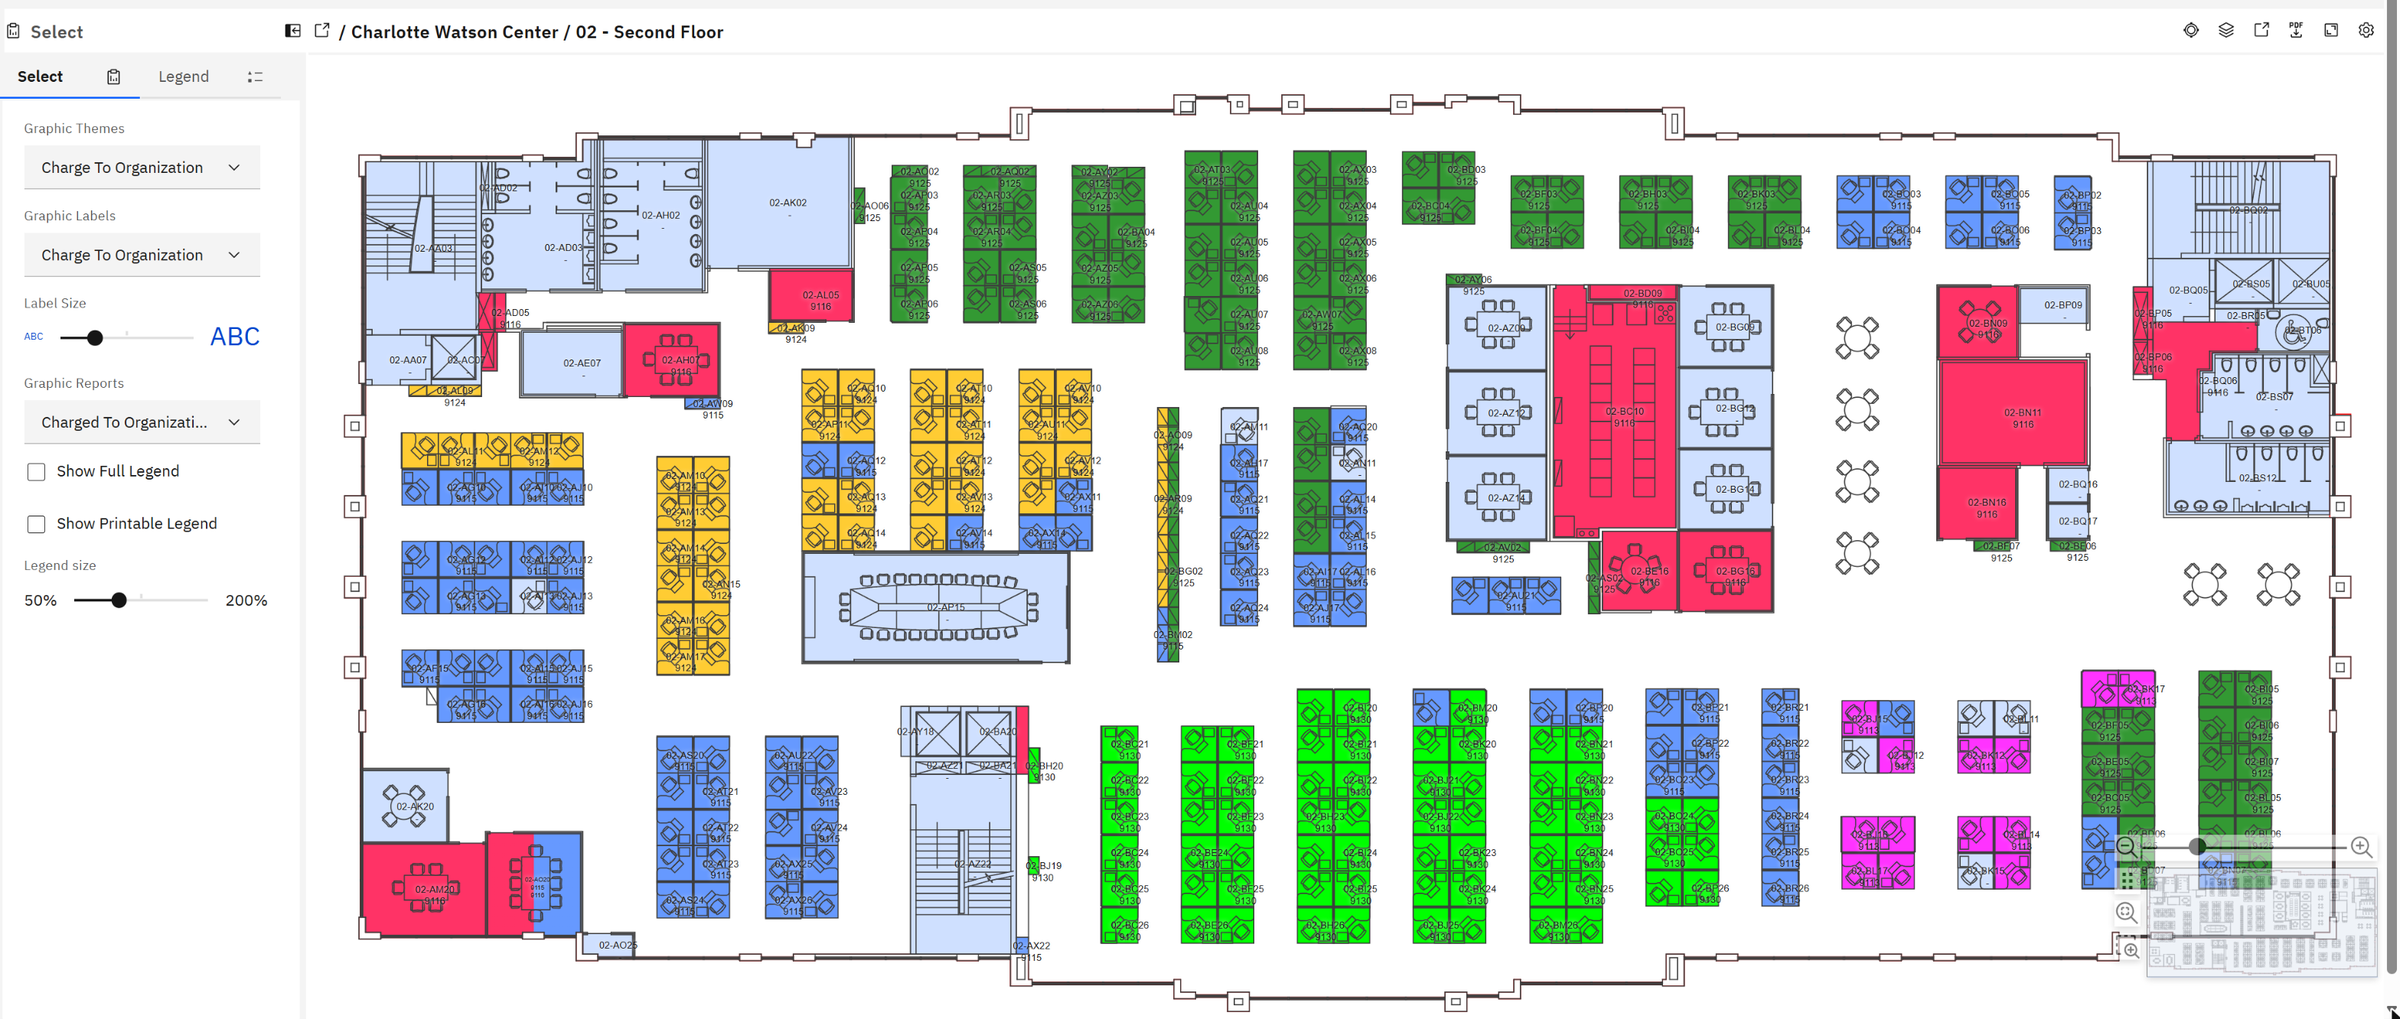
The classic Graphic tab gives the same view with room numbers and department codes printed in every room. It can be printed or saved as a PDF, which is useful for a meeting with a department head.
Chapter 5From one floor to the whole building: stack plans
Moving people desk by desk is not planning. Planners first decide which department goes on which floor, then do the details. That is a stack plan, named after the drawing of a building's floors stacked on top of each other.
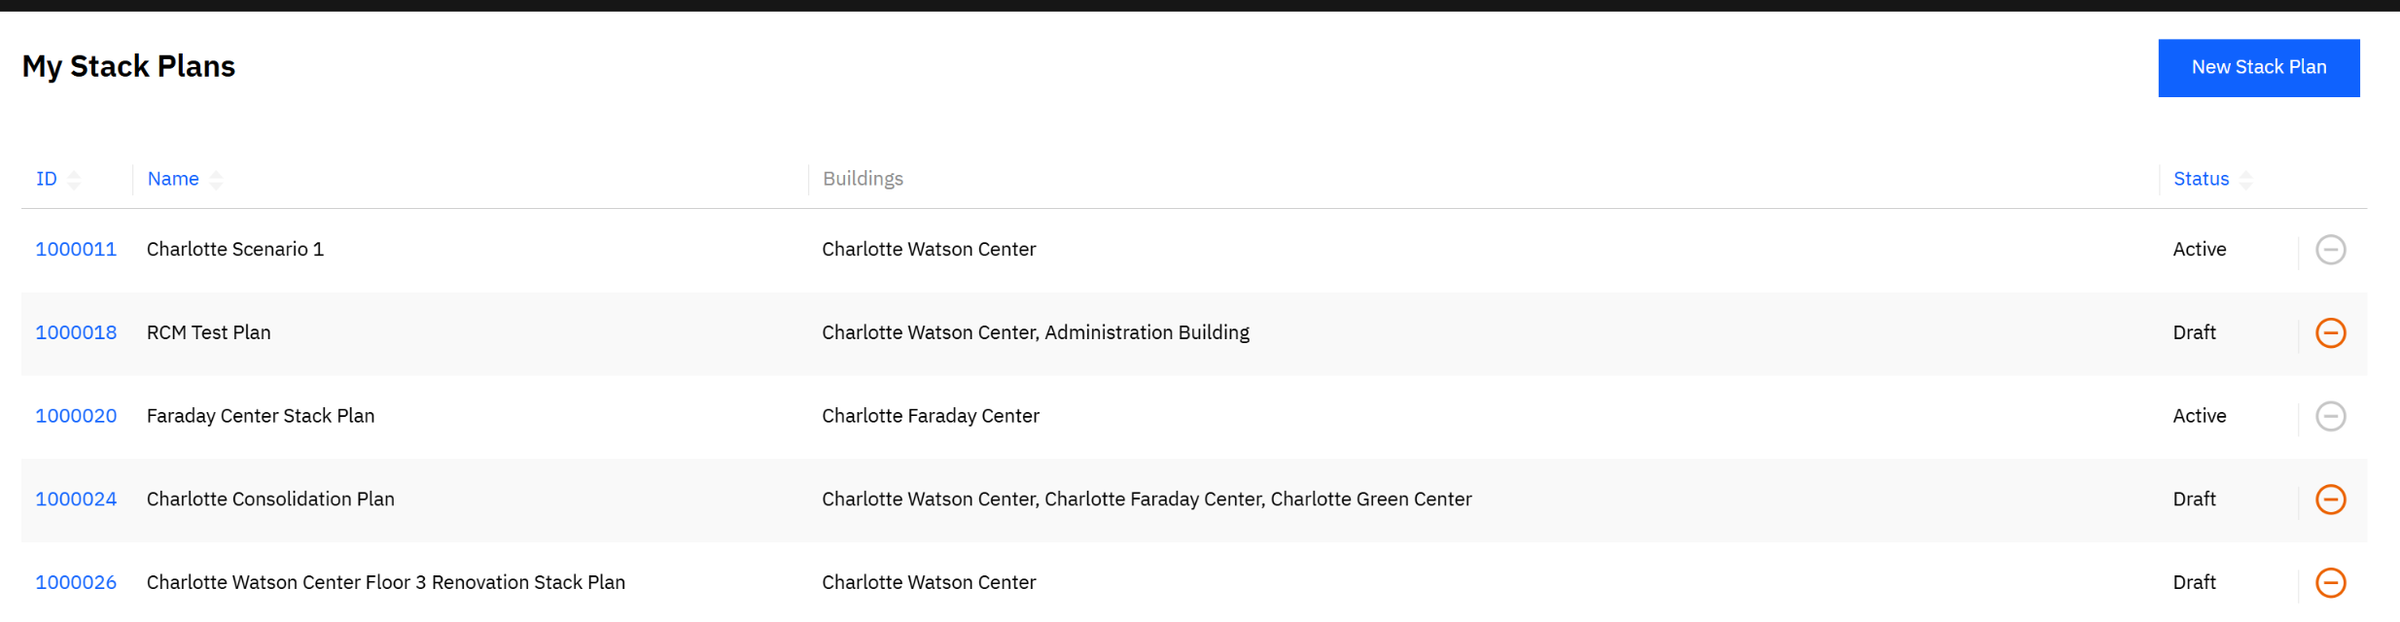
Our planner opens the Watson Center Floor 3 Renovation plan. It was created from chargeback allocations: MREF started from today's real situation (which department pays for how much space on which floor), so the plan begins from facts, not from a blank page.
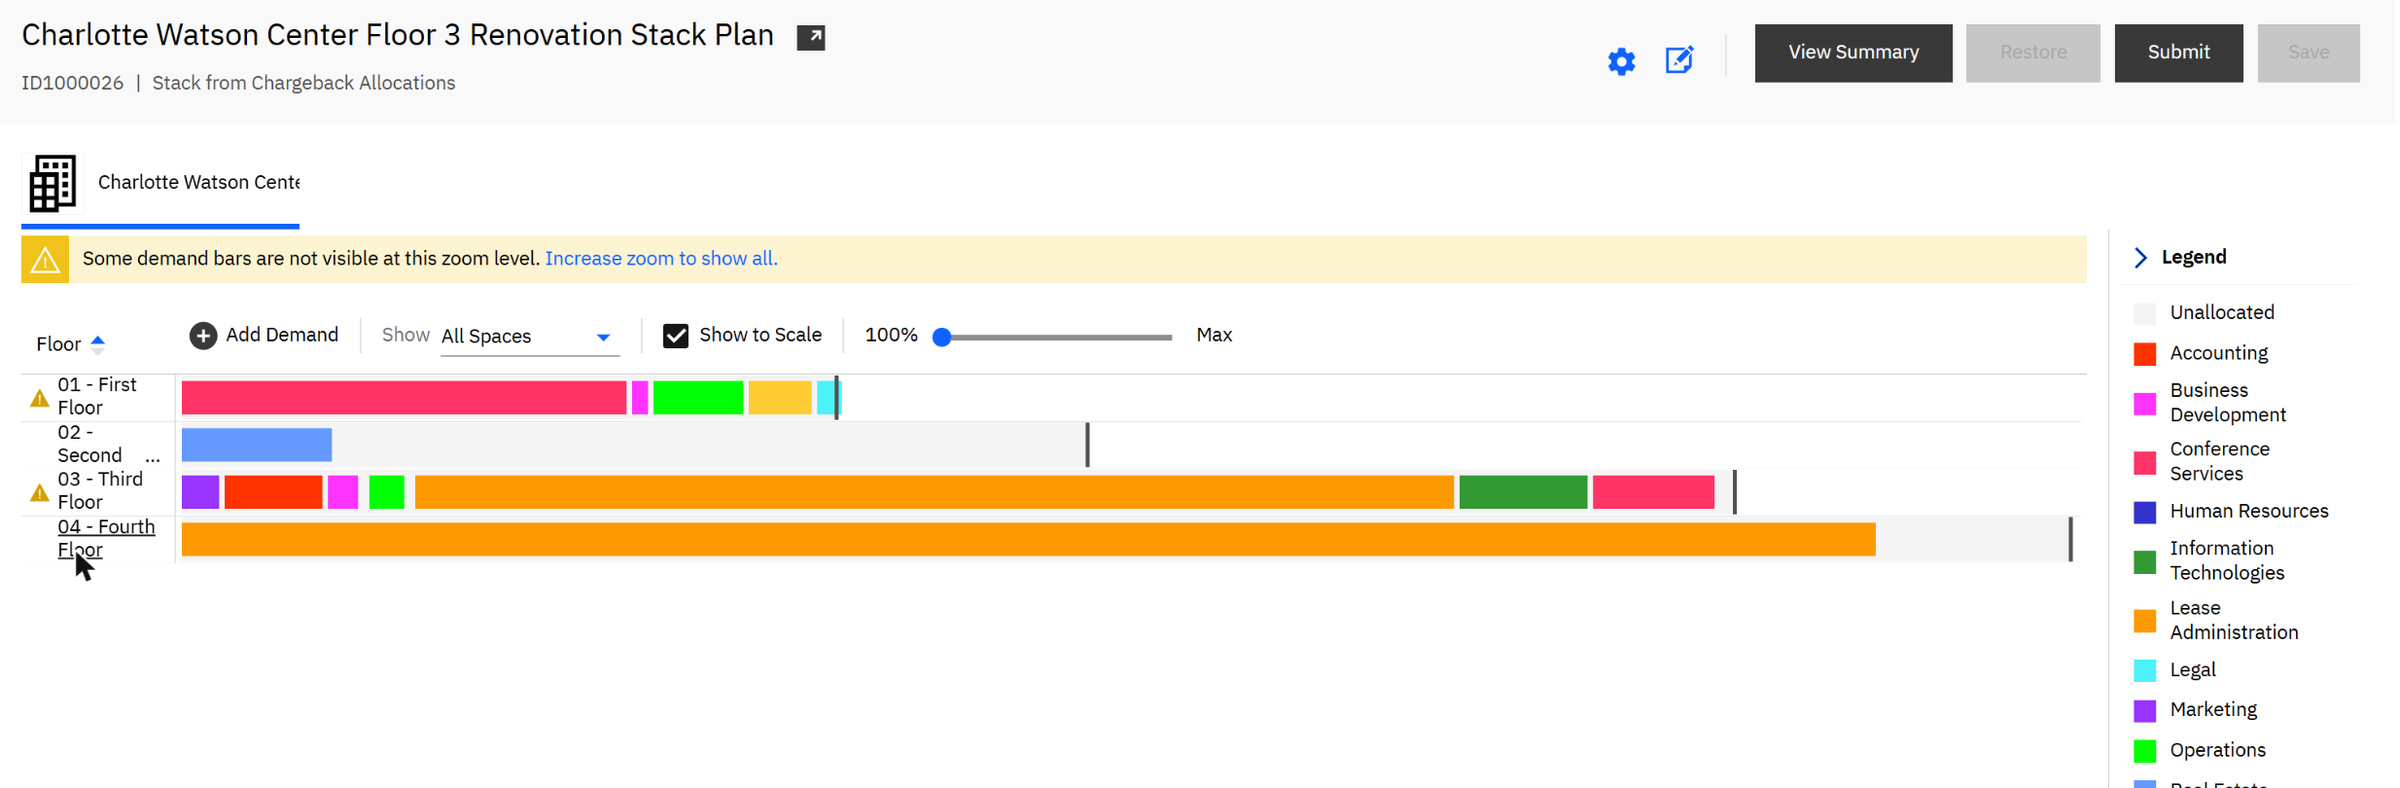
Each row is a floor. Each coloured block is a department, and its length is the area it occupies. Grey is unallocated space, and the dark vertical line marks how much the floor can hold. You drag blocks between floors to try a new layout, and MREF shows straight away whether a floor is overfilled.
Look at the second row. In this plan, floor 2 keeps only the Real Estate team, and almost the whole floor turns grey: free. Floor 1 takes Conference Services, Business Development, Operations, Sales and Legal; floors 3 and 4 hold Lease Administration, IT and the rest.
Chapter 6From plan to move list
A plan is only useful if people can carry it out. View Summary turns the stack plan into move items: who moves, how much space, from where, to where. With Show changed items only ticked, it lists just the changes.
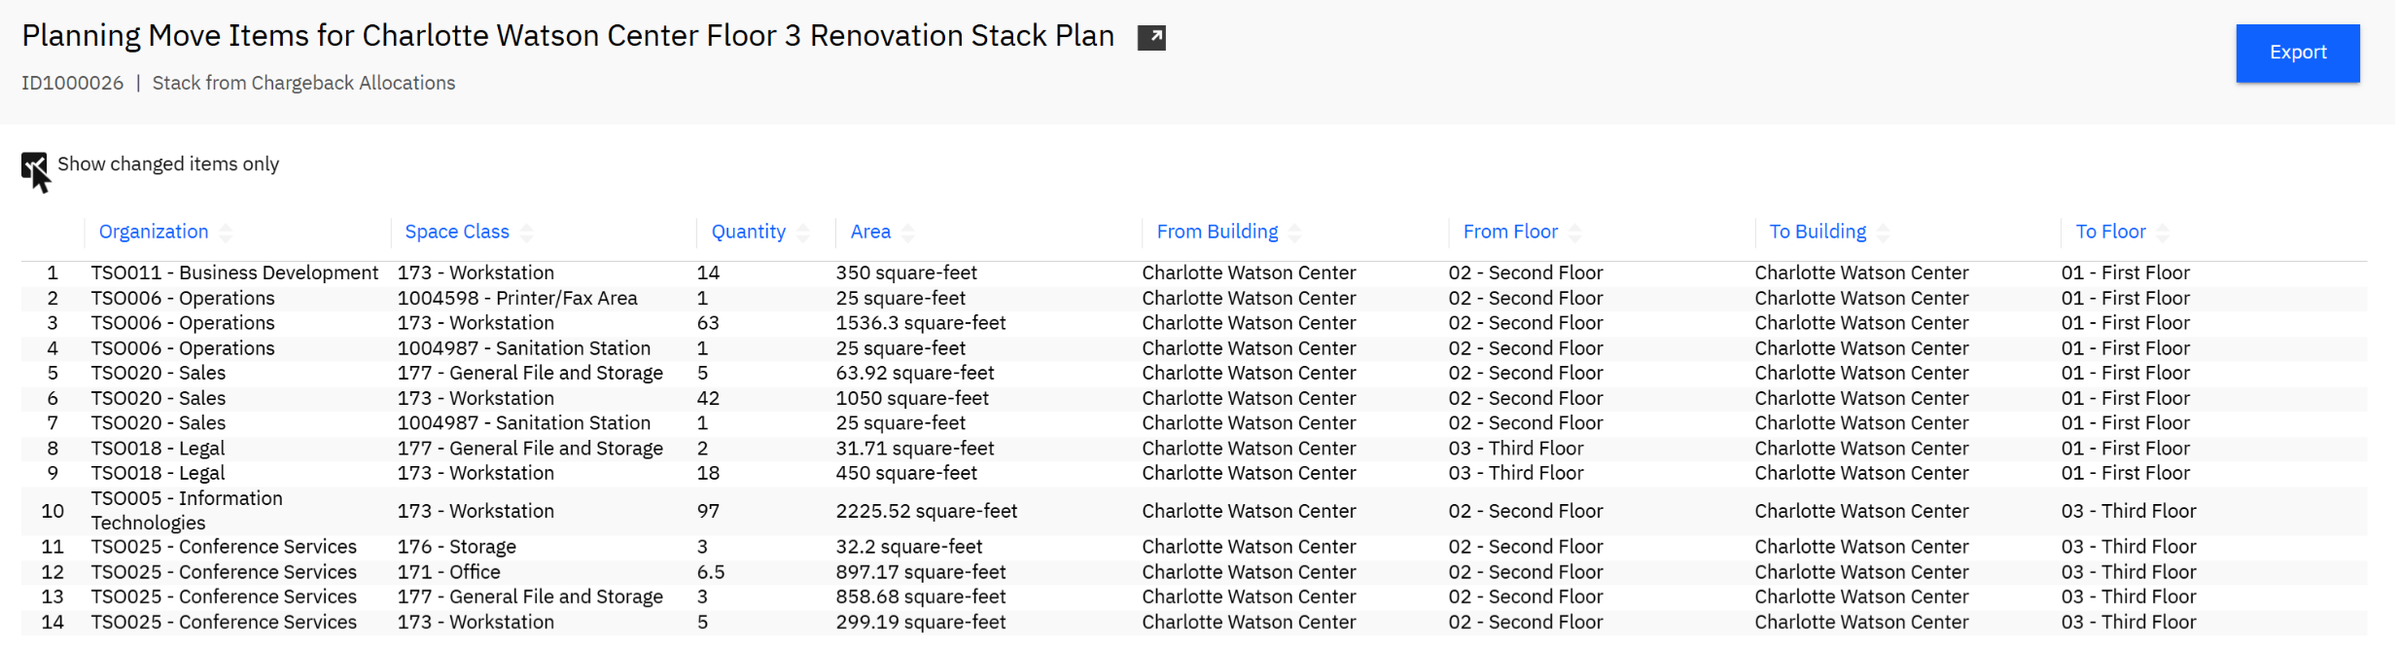
Workstations moving: Business Development 14 + Operations 63 + Sales 42 + Legal 18 + IT 97 + Conference Services 5 = 239 workstations, in fourteen move lines.
The biggest single move is IT: 97 workstations and 2,225.52 square feet, from floor 2 to floor 3.
The list can be exported and sent to the move team, and the plan submitted for approval. As the moves are carried out in MREF, the floor plans, assignments and chargeback follow them. The record from Chapter 2 is then correct again, without anybody re-entering it.
pplanner. Stack Plans on the home page opens the stacking tool;
open a plan, then View Summary. Space Plans/Scenarios and All Portfolio Plans do the same across several
buildings.What this gives the organization
- One true picture of space. Every floor, room, area and assignment in one place, drawn on the real floor plans.
- Empty space becomes visible. Utilization and occupancy are calculated, not guessed, so idle floors stand out.
- Departments own their cost. Chargeback ties every square foot to a budget, which drives better behaviour.
- Plans built on facts. Stack plans start from today's allocations and show straight away whether a layout fits.
- From decision to action. A plan becomes a move list, and the moves update the data when they are done.
Check yourself
1. A floor has a capacity of 200 and a headcount of 150. What is its utilization?
150 ÷ 200 = 75%.
2. A floor costs $500,000 a year and holds 100 people. Headcount drops to 50. What happens to the cost per person?
It doubles, from $5,000 to $10,000. The rent stays the same, so empty seats make occupied ones more expensive.
3. Usable area is 20,000 sq ft and rentable area is 22,000 sq ft. What is the load factor?
22,000 ÷ 20,000 = 1.10: you pay for 10% more area than you can use.
4. Why build a stack plan before moving individual desks?
Because the big decision is which department goes on which floor. Once that is fixed, the desk-level details are quick; the other way round, you redo the details every time the big picture changes.
5. Why does a stack plan freeing a whole floor matter more than one freeing the same area spread across three floors?
A whole empty floor can be given back, sublet or renovated. The same area scattered across floors saves nothing, because you still pay for every floor.
Glossary
- Capacity / headcount
- How many people a space can hold / how many are assigned to it.
- Utilization
- Headcount divided by capacity.
- Occupancy status
- Vacant, partially occupied, occupied or over-allocated, calculated from the assignments.
- Gross area
- The whole floor, measured to the outside of the walls.
- Usable area
- The area occupants actually use.
- Rentable area
- Usable area plus a share of the common areas.
- Load factor
- Rentable area divided by usable area.
- BOMA
- The industry standard for measuring and classifying office space.
- Space class
- The kind of room: workstation, office, meeting room, corridor and so on.
- Chargeback
- Charging each department for the space it holds.
- Stack plan
- A plan of which department goes on which floor.
- Move item
- One line of a plan: who moves, how much space, from where, to where.
Want to see this on your own buildings? Send me a message and I'll set up a demo.
Screens: IBM Maximo Real Estate and Facilities on IBM Maximo Application Suite, with IBM's GreenPoint demo data. All names, areas and amounts are demo values.